%20Bold.png)
Real-time CRM reporting updates your sales data constantly, giving you live insights into deals, bottlenecks, and tasks. Unlike outdated weekly or monthly exports, these systems refresh every 5 minutes, helping you make faster decisions. Companies using real-time data have reported up to 70% efficiency improvements and higher sales effectiveness.
Here’s how to set it up:
Clean, real-time data isn't just a convenience - it’s critical for better decisions and faster responses in today’s fast-paced sales environment.

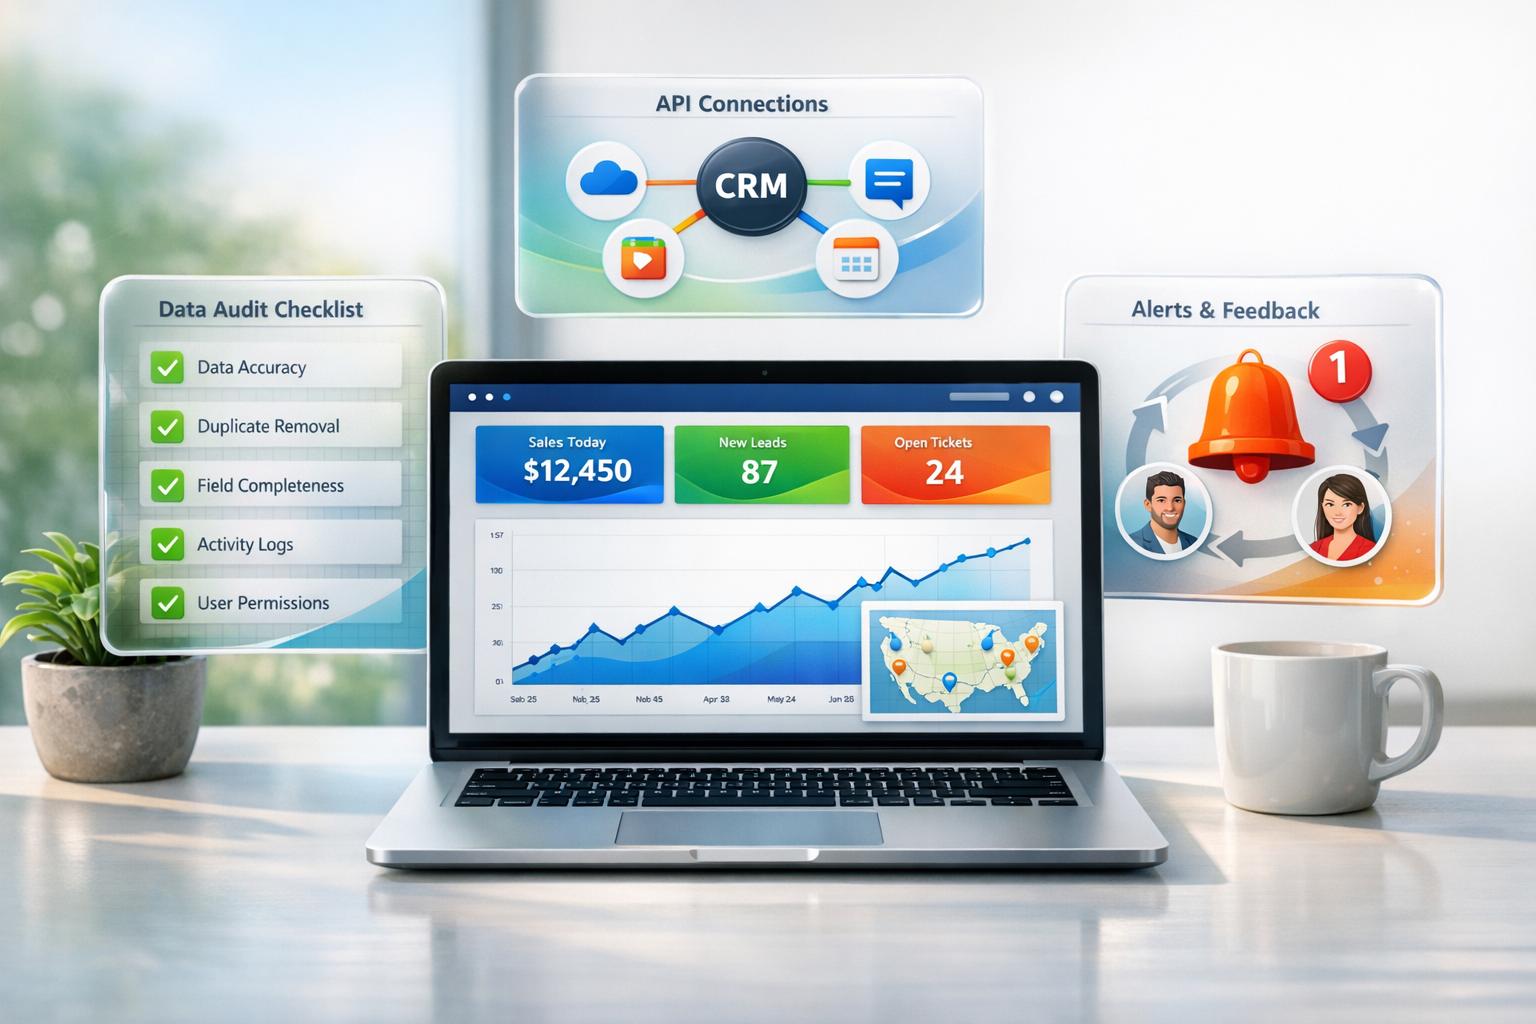
7-Step Real-Time CRM Reporting Setup Process
To make real-time reporting work for your CRM, you need a strong foundation. It's worth noting that 96% of sales professionals consider real-time data critical for adjusting business strategies[6]. But the truth is, data only becomes useful when it's accurate and well-organized from the start.
The key areas to focus on include auditing your existing data, ensuring systems are connected, and choosing tools that match your team's needs. Let's break down the steps to get your CRM ready for real-time reporting.
"Your real-time dashboard is only as good as your data. ... The fix isn't a better dashboard. It's better data." - Prospeo Team [6]
When done right, the payoff is clear: businesses using real-time data have seen 30% higher sales effectiveness and 15% better conversion rates. On the flip side, 40% of B2B organizations missed their quotas in 2023, often due to decisions based on outdated information[6].
Start by evaluating the data already in your CRM. Are sales reps consistently logging activities, updating deal stages, and recording lead sources? If not, you're not alone - less than 37% of sales reps consistently use their CRM, leading to gaps that will show up in your dashboards.
Another issue is data decay. B2B contact data deteriorates at a rate of 2.1% per month, or about 22.5% annually[6]. This makes it critical to verify and update contact information before building reports. Establish clear standards for key fields like deal value, stage, next action, and lead source to ensure consistency.
When it comes to metrics, start small. Focus on three to five key indicators that align with your current goals. Whether it's pipeline velocity, win rate, or lead response time, the goal is clarity. Use the "three-second rule": anyone should be able to understand headline figures at a glance[4].
| Metric | What It Measures | Target Benchmark |
|---|---|---|
| Lead Conversion Rate | % of leads that become customers | 2–5% (varies by industry) |
| Sales Cycle Length | Average days from first contact to close | 14–90 days |
| Win Rate | % of proposals/opportunities that close | 20–30% for new business |
| Pipeline Velocity | Speed at which deals move through stages | Track trend over time |
| Churn Rate | % of customers lost in a given period | Under 5% monthly |
Customize views based on roles. Sales reps should have a clear view of their pipeline and tasks, managers need team-wide metrics like conversion rates, and executives should see top-level data like revenue and ROI by lead source.
Once your data is cleaned up and key metrics are in place, it's time to confirm your systems can handle real-time reporting.
Real-time reporting typically involves querying your CRM every five minutes[1]. To support this, check your API limits to ensure they can handle the increased activity without hitting daily caps.
For example, Salesforce users might need to increase their API limits: REST API by 10,000, Batch by 5,000, and SOAP by 3,000. Similarly, HubSpot users should consider increasing their REST API limits by 10,000.
| System | REST API Increase | Batch API Increase | SOAP API Increase |
|---|---|---|---|
| Salesforce CRM | 10,000 | 5,000 | 3,000 |
| HubSpot CRM | 10,000 | – | – |
| Marketo MAP | 10,000 | – | – |
Check if your CRM supports native webhooks for instant updates. For example, Salesforce offers a Streaming API, and HubSpot provides webhooks for real-time notifications when records change. If certain objects don't support webhooks, platforms may use "virtual webhooks" via polling to simulate real-time updates[5].
When integrating multiple platforms, normalizing data structures is crucial. Align lifecycle stages and field mappings across systems, and organize your database with linked tables (e.g., Deals, Accounts, Activities, and Targets) to avoid duplication and enable live rollups. Allow 24 hours for historical data to sync before establishing a baseline[1].
With clean data and strong connectivity, you're ready to choose the right tools for reporting.
The tools you choose should match your team's size and the complexity of your data. For smaller teams (fewer than 50 reps) handling standard sales tracking, native CRM dashboards are often enough[6]. Platforms like monday CRM and SMBcrm offer drag-and-drop dashboards that update in real time.
For larger organizations that need to combine CRM, ERP, or finance data, dedicated BI tools like Tableau or Power BI are better options. While these tools require more setup - such as data modeling and integration - they provide the flexibility needed for more complex reporting needs[4].
| Feature | Native CRM Dashboards | Dedicated BI Tools (Tableau/Power BI) |
|---|---|---|
| Best For | Teams under 50 reps | Large organizations with complex data |
| Complexity | Low (built-in features) | High (requires data modeling) |
| Real-Time Capability | High (native sync) | Varies based on connector refresh rates |
Middleware platforms like Unified.to can simplify integrations by providing a single API surface across multiple CRMs, normalizing data objects and managing vendor-specific authentication and rate limits[5].
Don't forget to explore AI-powered features in modern reporting tools. Functions like predictive deal scoring, automated anomaly detection, and intelligent recommendations can flag opportunities needing attention without manual intervention[3]. These features turn dashboards into proactive tools for decision-making.
"With monday CRM, we're finally able to adapt the platform to our needs - not the other way around. It gives us the flexibility to work smarter, cut costs, save time, and scale with confidence." - Samuel Lobao, Contract Administrator & Special Projects, Strategix [3]
Once your data connectivity and dashboard setup are in place, the next stage involves four essential steps: connecting your data sources, building dashboards, enabling feedback loops, and configuring alerts. Each step works together to create a system that not only tracks activity but also helps you respond effectively.
Start by configuring your CRM's API for frequent updates. Set sync intervals to 5-15 minutes for lead updates and 30-60 seconds for live leaderboards[1][2].
Before activating real-time syncing, ensure the integration user has the right permissions, such as Primary Administrator or Data Workflows Administrator[1]. If you're unsure about permissions or API limits, refer back to the integration guidelines provided earlier.
In cases where native webhooks aren't available, middleware platforms like the Replit HubSpot Connector can simulate real-time updates through polling[2].
It's also important to complete a 24-hour historical sync before enabling real-time updates[1]. Regularly monitor the "Real-Time Data Sync" status page for issues like permission errors or API caps, which could pause synchronization for the day[1].
Once your connectivity is set, you can move on to crafting dashboards that provide actionable insights.
To build effective dashboards, tailor them to the needs of different roles. For instance, sales reps benefit from seeing pipeline metrics and next steps, while executives need a broader view, such as Customer Acquisition Cost (CAC) and growth trends.
Keep dashboards simple by focusing on 5 to 7 widgets per view, which helps avoid information overload[7]. Place the most critical metrics in the top-left corner, where users naturally focus first. Use color coding to highlight trends - green for positive results and red for areas that need attention. Update frequencies should match the urgency of the data: sales activity every 5-15 minutes and revenue summaries daily[3].
| Dashboard Component | Key Metrics | Update Frequency | Business Impact |
|---|---|---|---|
| Pipeline Health | Deal velocity, stage conversion rates, aging | 15-30 minutes | Identifies bottlenecks early and prevents stalls. |
| Revenue Performance | Revenue vs. target, win rate, deal size | Daily / Real-time | Tracks progress toward growth goals. |
| Sales Activity | Call volume, email engagement, meeting rates | 5-15 minutes | Pinpoints areas for coaching and improvement. |
| Lead Tracking | Volume by source, qualification rates, response time | Real-time | Ensures quick follow-up on high-priority leads. |
| Executive Summary | YOY growth, CAC, market share | Daily / Weekly | Offers strategic insights for decision-makers. |
Enable drill-downs so managers can dive deeper into metrics, from regional performance to individual results. Also, make dashboards mobile-friendly for easy access on the go.
Once dashboards are ready, the next step is to integrate feedback loops to enhance your CRM data.
Integrating insights directly into your CRM closes the reporting loop. This involves writing calculated scores, risk assessments, and AI-driven recommendations back into records. For example, you could assign churn risk scores to accounts based on engagement patterns or calculate close probabilities for deals using historical data. Real-time syncing can also enrich new CRM entries with firmographic data within minutes[1].
Activate "Real-Time Data Sync" settings on your integration platform to enable two-way data flow. This ensures your CRM not only pulls data but also gets updated with enriched insights. Over time, this approach makes your CRM smarter, with AI-enhanced data available directly within the system.
"Now we have a lot less data, but it's quality data. That change allows us to use AI confidently, without second-guessing the outputs." - Elizabeth Gerbel, CEO[3]
With feedback loops in place, you can move on to setting up alerts for immediate action.
Alerts are crucial for staying on top of changes like lead status updates, new high-value prospects, or contact unsubscriptions[8]. Use conditional thresholds to trigger alerts when specific metrics exceed limits. For example, notify the team if a deal remains in a stage longer than average or if daily call volume drops unexpectedly[3]. AI-powered tools can also flag unusual patterns that might otherwise go unnoticed.
Set up alerts for both key metrics and system errors to avoid missed opportunities or sync issues[1]. Deliver notifications through CRM alerts, automated emails, or instant messaging tools like Slack for quick visibility.
Automating these workflows can save teams 23% of their workday, allowing them to focus on selling rather than tracking data manually[8]. To avoid overwhelming users with notifications, use if/then logic to filter alerts based on specific criteria, reducing unnecessary noise[10].
Once your real-time dashboards are set up, the next step is ensuring the data feeding into them is consistent and reliable. Without clean, accurate data, even the most advanced dashboards can fall short.
For real-time reporting to work effectively, data consistency is non-negotiable. If similar entities are recorded differently, your insights can become skewed, leading to unreliable metrics. The key is establishing clear, organization-wide data entry rules - and sticking to them.
Start by simplifying the data requirements. Focus on critical fields like deal value, stage, lead source, and next action. A CRM with five well-maintained fields will always outperform one cluttered with unnecessary information across fifty fields[12]. Enforce validation rules for dates and numerical entries to minimize calculation errors in your dashboards. Additionally, adopt standardized naming conventions so everyone inputs data the same way. Where possible, automate data collection by syncing your CRM with tools like email and calendar systems.
Remember, data quality is the foundation of accurate reporting. Make it a priority during performance reviews to emphasize that clean and accurate inputs lead to meaningful outputs.
Data completeness is just as important as consistency. Automating validation processes can help flag errors like outliers or incorrect formats right away. Use audit logs from your integration platform to track successful record syncs and identify issues like permission errors or API limitations that could create gaps.
Conduct regular cross-system audits to identify inconsistencies. Establish clear protocols for handling missing data - whether that means imputing values, excluding records, or marking them as "N/A." AI-powered tools can simplify this process by spotting duplicates, standardizing fields, and flagging inconsistencies in real time. In fact, organizations using generative AI in marketing and sales have seen revenue growth in 66% of cases[13].
"Visibility determines whether you hit your numbers or miss them." - monday.com[13]
When your data is complete and accurate, you set the stage for advanced tools to take your reporting to the next level.
AI-augmented tools can transform your real-time reporting from a basic operational tool into a strategic powerhouse. These solutions automatically clean up data, enrich records, and minimize human error, ensuring your reports reflect the true state of your performance. They can even process unstructured data like PDFs, spreadsheets, and call transcripts, turning them into actionable CRM insights - eliminating the need for manual data entry.
Machine learning can monitor data streams to detect trends, anomalies, and emerging patterns. For example, Visora's AI-augmented business development systems combine CRM capabilities with buyer-intent signals and private market intelligence. This approach allows B2B leaders to build deal flow and shorten sales cycles in just 12 weeks - without relying on referrals or hefty ad spending. Their revenue advisory services integrate seamlessly with real-time reporting, ensuring your CRM not only tracks activity but also informs strategic decisions.
Once your pilot team has demonstrated the success of real-time reporting, the next hurdle is expanding it across your entire organization without disrupting existing workflows. Using the pilot as a foundation, you can scale while ensuring data accuracy and maintaining system performance. This step requires thorough validation, clear governance, and a well-thought-out roadmap to keep everything on track.
Before rolling out real-time reporting company-wide, make sure your dashboards reflect the data accurately. Start by mapping all data sources and verifying that connections, field mappings, and schemas are correct [11]. Conduct targeted tests by comparing raw data with dashboard outputs, running key business scenarios, and examining edge cases like blank fields or unusually large values [11]. Involving end-users in the testing process can help ensure the reports are clear and actionable for everyone. A phased rollout can be helpful - begin with core data like contacts and companies, and then move to more complex information such as deals, activities, and historical data [9]. Using AI-driven anomaly detection can also help by monitoring key metrics and flagging unexpected patterns [3].
Once data accuracy is confirmed, focus on creating secure and standardized access for all users. Role-Based Access Control (RBAC) can limit data access based on roles, while data masking and filtering can protect sensitive information [11]. Standardizing data entry protocols and naming conventions will help prevent inconsistencies, and documenting data sources, KPI definitions, and reporting processes ensures everyone has a shared understanding [9][12]. Audit trails can add an extra layer of security by tracking changes and modifications. Effective governance not only improves compliance but also reduces manual work - finance teams, for instance, often spend more than 48% of their time preparing and updating reports [14].
With accurate and governed data in place, develop a step-by-step plan for scaling your reporting system. Start by cleaning your data, defining key properties, and setting consistent naming conventions to establish data integrity before piloting key metrics [9][11]. Once the system has been rigorously tested through user feedback and manual checks, implement governance features like RBAC, multi-factor authentication, and audit trails [11]. During the expansion, create dashboards tailored to different roles: sales reps might need views of their pipelines and tasks, managers might focus on team performance and forecasts, and executives might prioritize top-line revenue and ROI metrics [12][3]. Finally, transition to automated exports and interactive dashboards to encourage consistent usage across the organization [11].
For an added boost, consider integrating tools like Visora's advanced CRM systems. Their services combine real-time reporting with AI-enhanced business development, buyer-intent signals, and private market intelligence. This approach helps B2B leaders streamline revenue generation and shorten deal cycles. With a solid strategy, your CRM reporting can go beyond just tracking activity - it can drive informed, strategic decisions across every department.
Real-time CRM reporting has reshaped how B2B organizations make decisions. By implementing the strategies outlined here, you can move away from outdated spreadsheets and embrace live, actionable insights. As the SMBcrm Team aptly states:
"A CRM without reporting is a filing cabinet. It stores information, but it does not help you act on it" [4].
Automated CRM workflows can increase administrative efficiency by as much as 70% [3], while also helping to identify bottlenecks and spot declining conversion rates early. For instance, when your sales team responds to inbound leads in under 5 minutes - a key benchmark for optimizing conversions [4] - and managers use live activity data to coach their teams rather than relying on end-of-month reports, your organization gains a clear edge over competitors.
However, these benefits hinge on maintaining high-quality data. Conduct weekly metric reviews and monthly ROI analyses to ensure your data remains reliable - after all, poor data quality can cost organizations upward of $5 million annually [15].
For leaders in industries like investment, finance, real estate, SaaS, and consulting, Visora provides advanced CRM systems that integrate real-time reporting, AI-driven business development, and private market intelligence. Their tools are designed to build proprietary deal flow and reduce deal cycles within 12 weeks, turning your CRM into a revenue-boosting asset for every department.
When tracking operational KPIs, focus on metrics that reveal potential challenges or opportunities directly tied to revenue. Key areas to monitor include:
These KPIs should deliver weekly updates and align closely with your sales cycle and objectives. Skip vanity metrics or outdated data that lack real-time relevance. Instead, focus on actionable insights that can guide decisions and boost short-term performance.
To keep your real-time CRM sync running smoothly without hitting API limits, consider using event-driven methods like webhooks. These allow for instant updates, cutting down on the need for constant polling.
Make sure your sync process includes key elements like rate limit management, conflict resolution, and error handling to avoid disruptions. You can also reduce API usage by implementing OAuth 2.0 for secure access and fine-tuning your polling frequency to optimize performance while staying within limits.
Keeping your CRM data clean and accurate is essential for maintaining reliable live dashboards. Start by ensuring consistent data definitions - for example, clearly defining lifecycle stages. This reduces the chances of discrepancies creeping in.
Another helpful approach is implementing a CRM health scorecard. This tool can flag potential issues early, giving you a chance to address them before they spread. Pair this with regular data audits and validations to catch and correct errors, ensuring your dashboards remain trustworthy and accurate. These steps work together to keep your reporting dependable and error-free.
%20(5).png)
