%20Bold.png)

Content ROI is about measuring how much revenue your content generates compared to its cost. The formula is simple: ((Revenue – Costs) / Costs) × 100. Yet, 44% of B2B companies don’t track ROI, leaving content efforts undervalued and at risk of budget cuts.
Content marketing delivers long-term returns, with some campaigns achieving 844% ROI over three years. By tracking and optimizing ROI, you can justify budgets and focus on high-impact content.
Measuring the right metrics is crucial for understanding how B2B content contributes to revenue. It’s not just about tracking numbers; it’s about focusing on metrics that tie directly to pipeline growth and sales impact. Surprisingly, 42% of B2B marketers struggle with measuring content ROI effectively [2]. Why? Many rely on vanity metrics like page views instead of metrics that demonstrate actual business outcomes.
In 2024, only 55.3% of B2B marketers tracked MQLs (a drop from 72% in 2023) as teams shifted toward account-based metrics. This change reflects the reality that 92% of B2B purchasing decisions are made by groups [7]. Account-based metrics align better with how buying committees operate.
"The real measure of success for content marketing B2B lead generation is found in your sales funnel, not in your website traffic." - Harshita Chopra, DemandZen [4]
Let’s dive into key metrics that directly connect content performance to revenue.
The MQL-to-SQL conversion rate is a strong indicator of whether your content is reaching the right audience. High conversion rates mean your content addresses specific pain points and attracts qualified buyers. On the other hand, low rates could signal a mismatch between your messaging and your audience’s needs.
High-intent leads, often referred to as CQLs, typically engage with assets like whitepapers, webinars, or ROI calculators. Tracking which content generates the highest SQL conversions helps justify budget allocation based on actual revenue potential, not just traffic.
Take Datanyze, for example. In 2025, they revamped their content strategy with integrated tracking tools, resulting in a 135% boost in organic search traffic and a 5x increase in leads. Their efforts led to an impressive 23% lead-to-customer conversion rate [2]. By using UTM parameters on every call-to-action and download link, they could trace SQLs back to specific content pieces.
To quantify lead value, multiply the number of SQLs from a content piece by your average SQL value. For instance, if a whitepaper generates 50 SQLs and each SQL is worth $2,000, that single asset contributes $100,000 to your pipeline [6].
Traffic alone doesn’t tell the whole story. Metrics like time on page, scroll depth, and on-page clicks reveal whether visitors are engaging with your content or simply bouncing off. For example, an average time on page of 3–5 minutes suggests readers are consuming your content meaningfully [8].
Analyzing user behavior - such as where they navigate after reading - can show if your content effectively guides them toward deeper engagement or conversion [8]. Similarly, CTA click-through rates measure how well your content motivates action. If a post performs well in traffic but has low CTA engagement, it might be time to reevaluate the CTA’s placement or value.
"If you don't know where people go from the content, you don't know how well it's performing, how well it's guiding visitors deeper, how well it's getting visitors closer to the conversion." - Andy Crestodina, Orbit Media [8]
Kelly Services saw a 32% increase in website users and a 60% boost in conversions within eight months by unifying their content operations with CRM tracking. This success came from shifting to personalized content based on scroll depth and navigation patterns [2].
Metrics like pipeline velocity and revenue attribution go beyond engagement, showing how content directly impacts sales. Pipeline velocity measures how quickly prospects move through the sales funnel, while multi-touch attribution assigns credit to various content touchpoints throughout the buyer’s journey [4][2]. These frameworks, such as W-shaped or U-shaped attribution models, balance credit across top-funnel awareness content and bottom-funnel conversion assets.
Another critical metric is the content-to-opportunity rate, which tracks how many prospects transition into sales opportunities after engaging with specific content [2]. This directly connects content to pipeline creation, not just lead generation.
AddVision provides a great example. By centralizing their marketing automation and using multi-touch attribution, they achieved an 800% increase in monthly leads. They also identified which content combinations were most effective in closed-won deals [2].
| Metric Category | Key KPIs to Track | Purpose |
|---|---|---|
| Lead Quality | MQL to SQL Conversion, Content-to-Opportunity Rate | Determines if content attracts qualified buyers [4][2] |
| Engagement | Time on Page, Scroll Depth, CTA Clicks | Measures how well content resonates with users [6][7] |
| Pipeline | Deal Velocity, Pipeline Influenced by Content | Tracks content’s role in accelerating sales [2] |
| Revenue | LTV:CAC Ratio, Content-Attributed Revenue | Links content to profitability and ROI [2] |
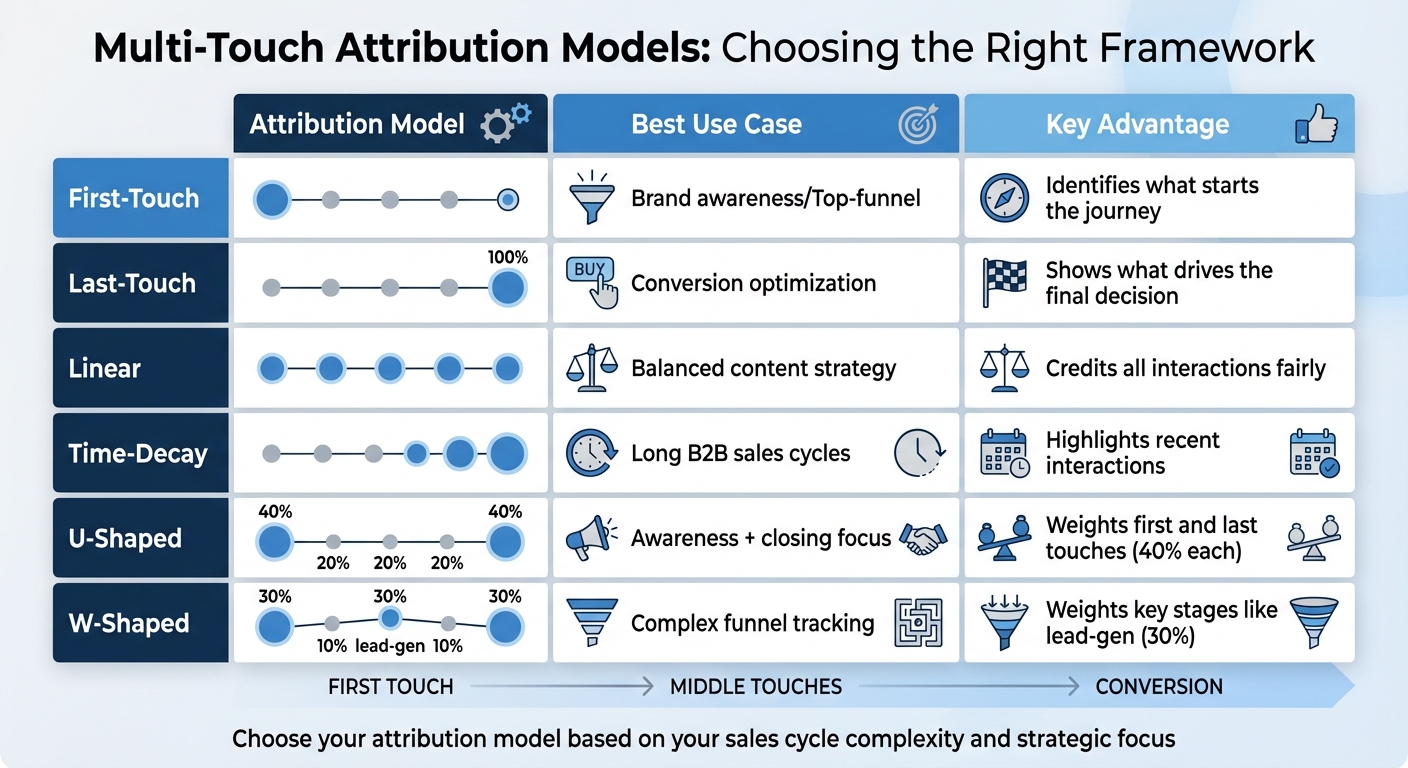
Multi-Touch Attribution Models Comparison for B2B Content Marketing
Tracking metrics is one thing, but determining the financial return of your content efforts is a whole different challenge. Surprisingly, 47% of B2B marketers don't measure their content marketing ROI at all [12], and among those who do, 69% aren't confident in their methods [5][3]. To bridge this gap, several frameworks can help quantify content's financial impact.
The goal is to move beyond simple correlations - where one event is assumed to cause another - and uncover true causation. B2B deals often involve over 100 touchpoints across multiple stakeholders [5][3], so it's crucial to use methods that account for this complexity. The most effective strategy combines multiple calculation techniques rather than relying on just one [3].
Multi-touch attribution assigns financial credit to every content interaction throughout the buyer's journey. Unlike first-touch or last-touch models, which oversimplify the process, multi-touch models acknowledge that content nurtures prospects over time.
To set up attribution, start by centralizing customer touchpoints using a data platform. Integrate your CMS, marketing automation, and CRM systems to connect engagement data with revenue [2]. Without this integration, gaps in your data can disrupt attribution chains [5][3].
Here are some tips for effective attribution:
Different attribution models work in unique ways. For example, W-shaped attribution assigns 30% credit each to the first touch, lead creation, and opportunity creation, with the remaining 10% spread across other interactions. This is ideal for complex B2B sales [2]. Time-decay models prioritize recent interactions, reflecting their increased importance in long sales cycles [5][9]. Linear attribution, on the other hand, gives equal weight to all touchpoints, which can help maintain a balanced content strategy [5].
"Linking individual content pieces back to real dollars generated is so valuable for marketing teams. Not only will it help you justify scaling your content efforts... it will help you focus on what really matters for your (potential) customers."
- Emily Byford, Writer and Content Marketer [1]
To track multiple content touchpoints in your CRM, enable native features like "Campaign Influence" in Salesforce or use the Attribution Reports in HubSpot [5]. You can also create custom CRM properties, such as "First Content Type" or "Content Funnel Stage", to categorize interactions beyond URLs. Regularly auditing your data quality - at least quarterly - can prevent synchronization issues [5][3].
| Attribution Model | Best Use Case | Key Advantage |
|---|---|---|
| First-Touch | Brand awareness/Top-funnel | Identifies what starts the journey |
| Last-Touch | Conversion optimization | Shows what drives the final decision |
| Linear | Balanced content strategy | Credits all interactions fairly |
| Time-Decay | Long B2B sales cycles | Highlights recent interactions |
| U-Shaped | Awareness + closing focus | Weights first and last touches (40% each) |
| W-Shaped | Complex funnel tracking | Weights key stages like lead-gen (30%) |
Attribution models are just the start. To gain deeper insights, you can map the complete customer journey.
Customer journey mapping brings together every lead, opportunity, and content interaction into a single timeline [10]. This is especially useful in B2B, where multiple stakeholders engage with different content pieces to influence a single deal [10][11].
One powerful tool within journey mapping is Lift Analysis. This measures the incremental revenue generated by audiences who interacted with specific content versus those who didn’t [11]. It highlights the counterfactual impact - the revenue you would have missed if certain content hadn’t been used [10].
Journey mapping also tracks assisted conversions, giving top-of-funnel content the credit it deserves, even if it wasn’t the final touchpoint before conversion [2]. By analyzing these interactions, you can determine which content formats - like technical whitepapers or industry reports - resonate most with specific buyer segments or decision-makers.
"B2B buying involves multiple people, each consuming different content at different times. Your content might educate a product manager, who then influences a director."
- Daniel Riojas, Senior Content Strategist, Directive Consulting [2]
For effective journey mapping, focus on account-level tracking rather than individual leads, as B2B decisions are typically made by groups [10][11]. Use the Jobs-to-be-Done Framework to categorize content by purpose - Acquisition, Selling, or Retention - for easier measurement aligned with funnel goals [2]. Additionally, assign "Part-Worths" using statistical methods to allocate portions of deal value to each content interaction [10]. Modern tools now use advanced fingerprinting techniques to track engagement across sessions and devices, ensuring accuracy without relying on cookies [11].
While journey mapping provides a complete view of the customer path, incrementality testing isolates content's direct financial impact.
Incrementality testing measures content’s true lift by comparing results from a test group exposed to the content with a control group that wasn’t [3]. This method avoids correlation-based biases and focuses on specific initiatives rather than broad multi-channel strategies [3].
Here’s how it works:
Track both groups through your CRM, monitoring pipeline creation and closed deals instead of just top-funnel metrics [3]. The difference in revenue outcomes between the two groups represents the incremental value your content generated [3].
Timing is everything. B2B content often takes 3–6 months to show results, with full ROI emerging around month seven [2]. Make sure your testing period accounts for this timeline. Use a unified tech stack where your CMS, marketing automation, and CRM communicate in real time to avoid data gaps [5][2]. For a complete ROI picture, pair incrementality testing with multi-touch attribution and marketing mix modeling [3].
Marketing Mix Modeling (MMM) uses statistical analysis to determine how much of your overall marketing results can be attributed to content versus other channels [3]. Unlike multi-touch attribution, which focuses on individual touchpoints, MMM offers a big-picture view of how different channels contribute to revenue over time [3].
This method is particularly useful when individual-level tracking isn’t possible. MMM analyzes historical data to find patterns between content investment, distribution, and revenue generation across your entire marketing mix.
"The 'base' of a marketing attribution model is the purest definition of brand equity."
- Andy Hasselwander, Marketbridge [10]
MMM accounts for factors like seasonality, competition, and market conditions, isolating the specific contribution of content marketing [3]. For example, building an attribution infrastructure for MMM can cut costs by up to 75% over five years, reducing expenses from $250,000 to $60,000 [5]. However, MMM requires at least two years of historical data and statistical expertise to build accurate models.
While MMM provides strategic insights about channel performance, it doesn’t offer the granular content-level detail that other methods like multi-touch attribution or incrementality testing provide [3]. Combining these approaches gives you both the high-level strategy and detailed insights needed to optimize your content investments.
Using the right tools to measure content performance is essential for tying those efforts to revenue - a common challenge in B2B content marketing. In fact, 42% of B2B marketers struggle to measure content ROI consistently [2]. This often happens because many tools fail to link content interactions directly to revenue. The right platforms can bridge this gap, making it easier to see how your content impacts the bottom line.
To go beyond surface-level metrics like page views, your tools need to track anonymous visitors across multiple sessions, connect those visits to known leads in your CRM, and tie content engagement to closed deals. Considering that B2B deals often involve 100+ touchpoints [5][13], your tools must handle these complex, multi-touch, and multi-month journeys.
Below are some platforms that take different approaches to measuring B2B content ROI. Some focus on web analytics, others on content engagement, and a few specialize in revenue attribution. Choosing the right one depends on your sales cycle, content strategy, and specific needs.
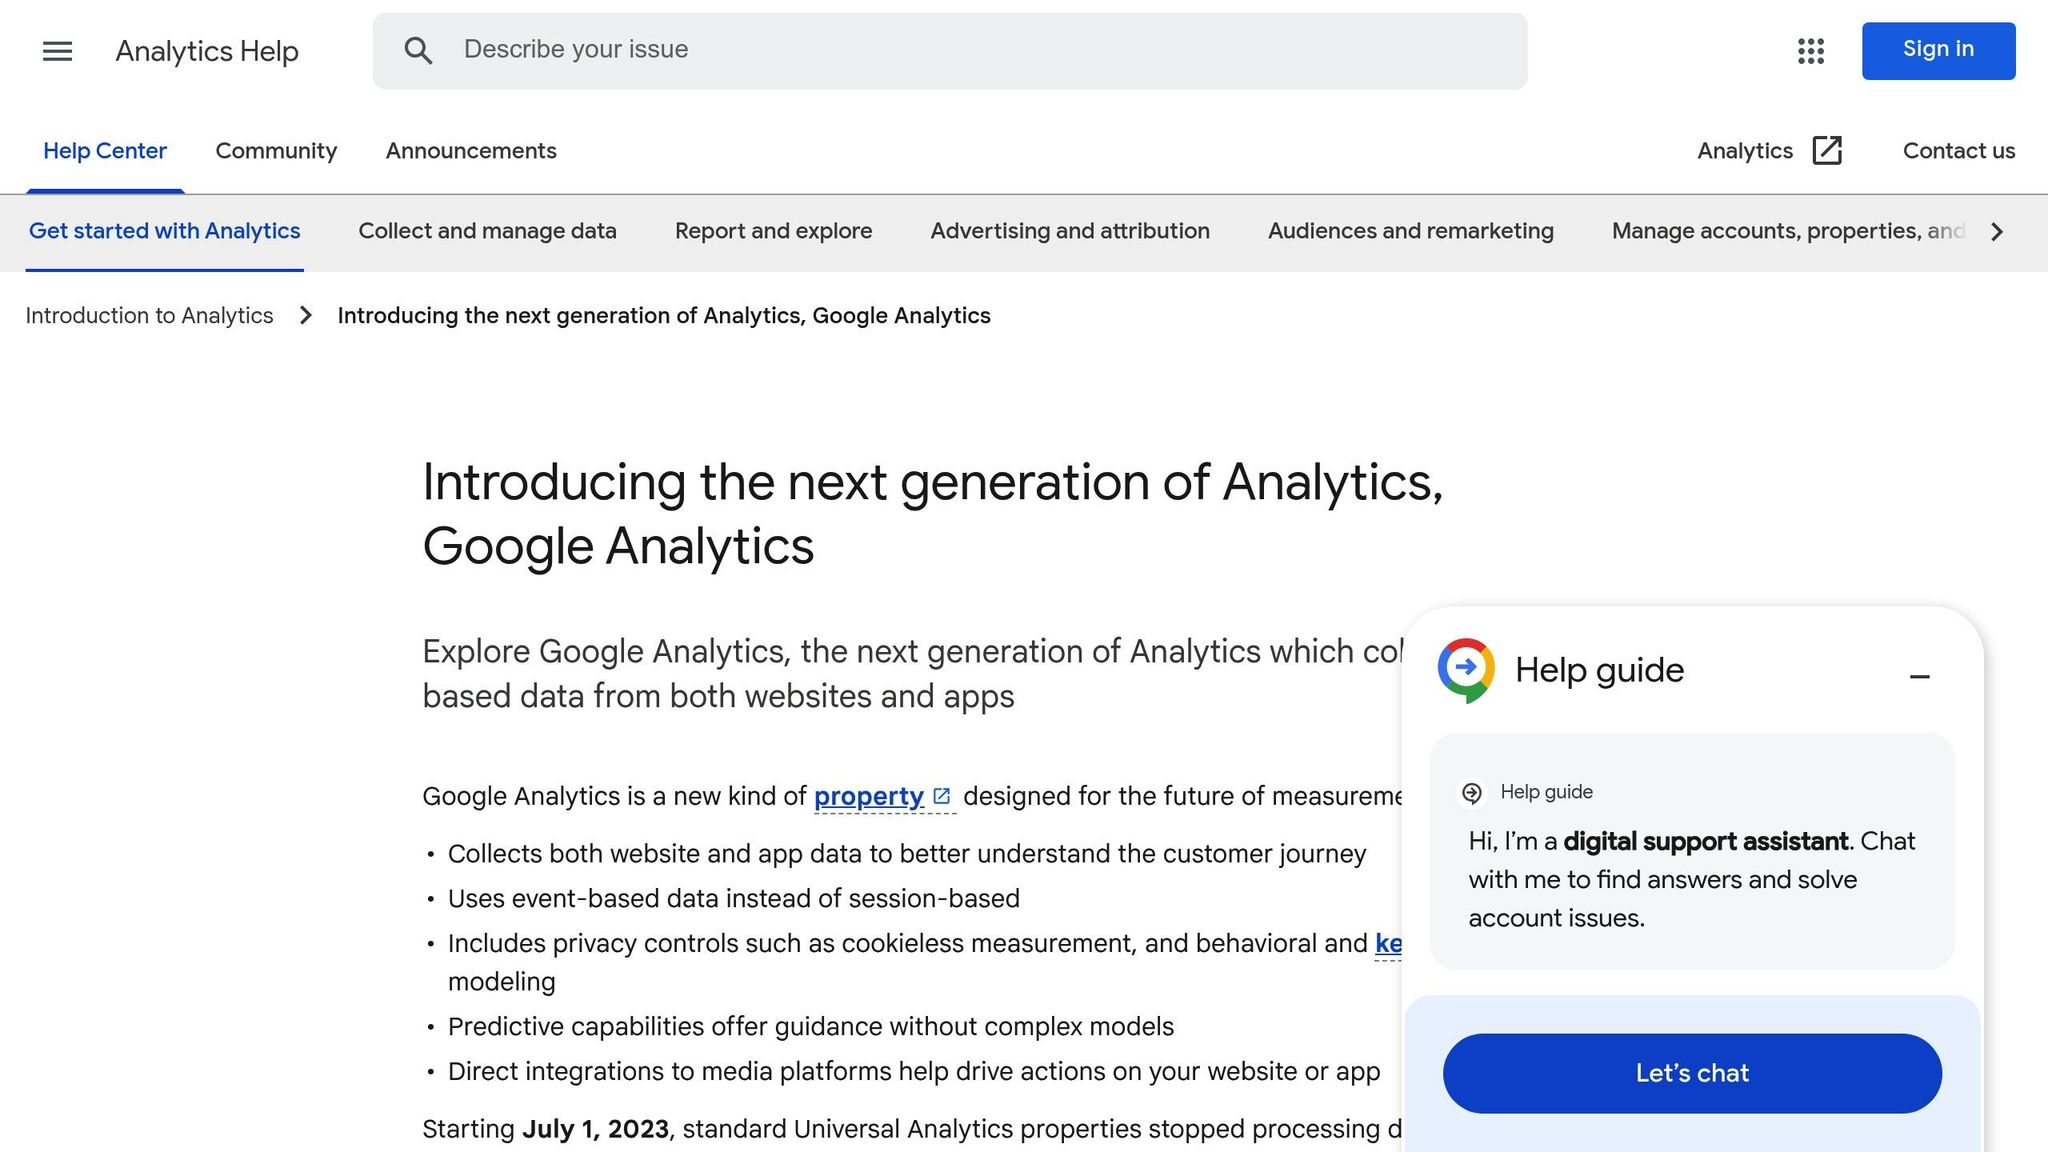
Google Analytics 4 (GA4) is a staple for many B2B marketers. Its event-based tracking allows you to monitor specific actions - like whitepaper downloads or demo requests - and connect them to conversion goals. The Model Comparison Tool helps analyze how different attribution models (first-touch, last-touch, linear) assign credit to your content [14].
GA4 also excels at breaking down UTM parameters and grouping content by type (e.g., blog posts, webinars) or funnel stage (awareness, consideration, decision). However, its 90-day lookback window can be a limitation for longer B2B sales cycles, as it may credit later touchpoints instead of the content that initiated the relationship [14]. A workaround is to treat key interactions like content downloads as "purchase" events, enabling GA4 to use its revenue attribution features even for non-ecommerce sites [5].
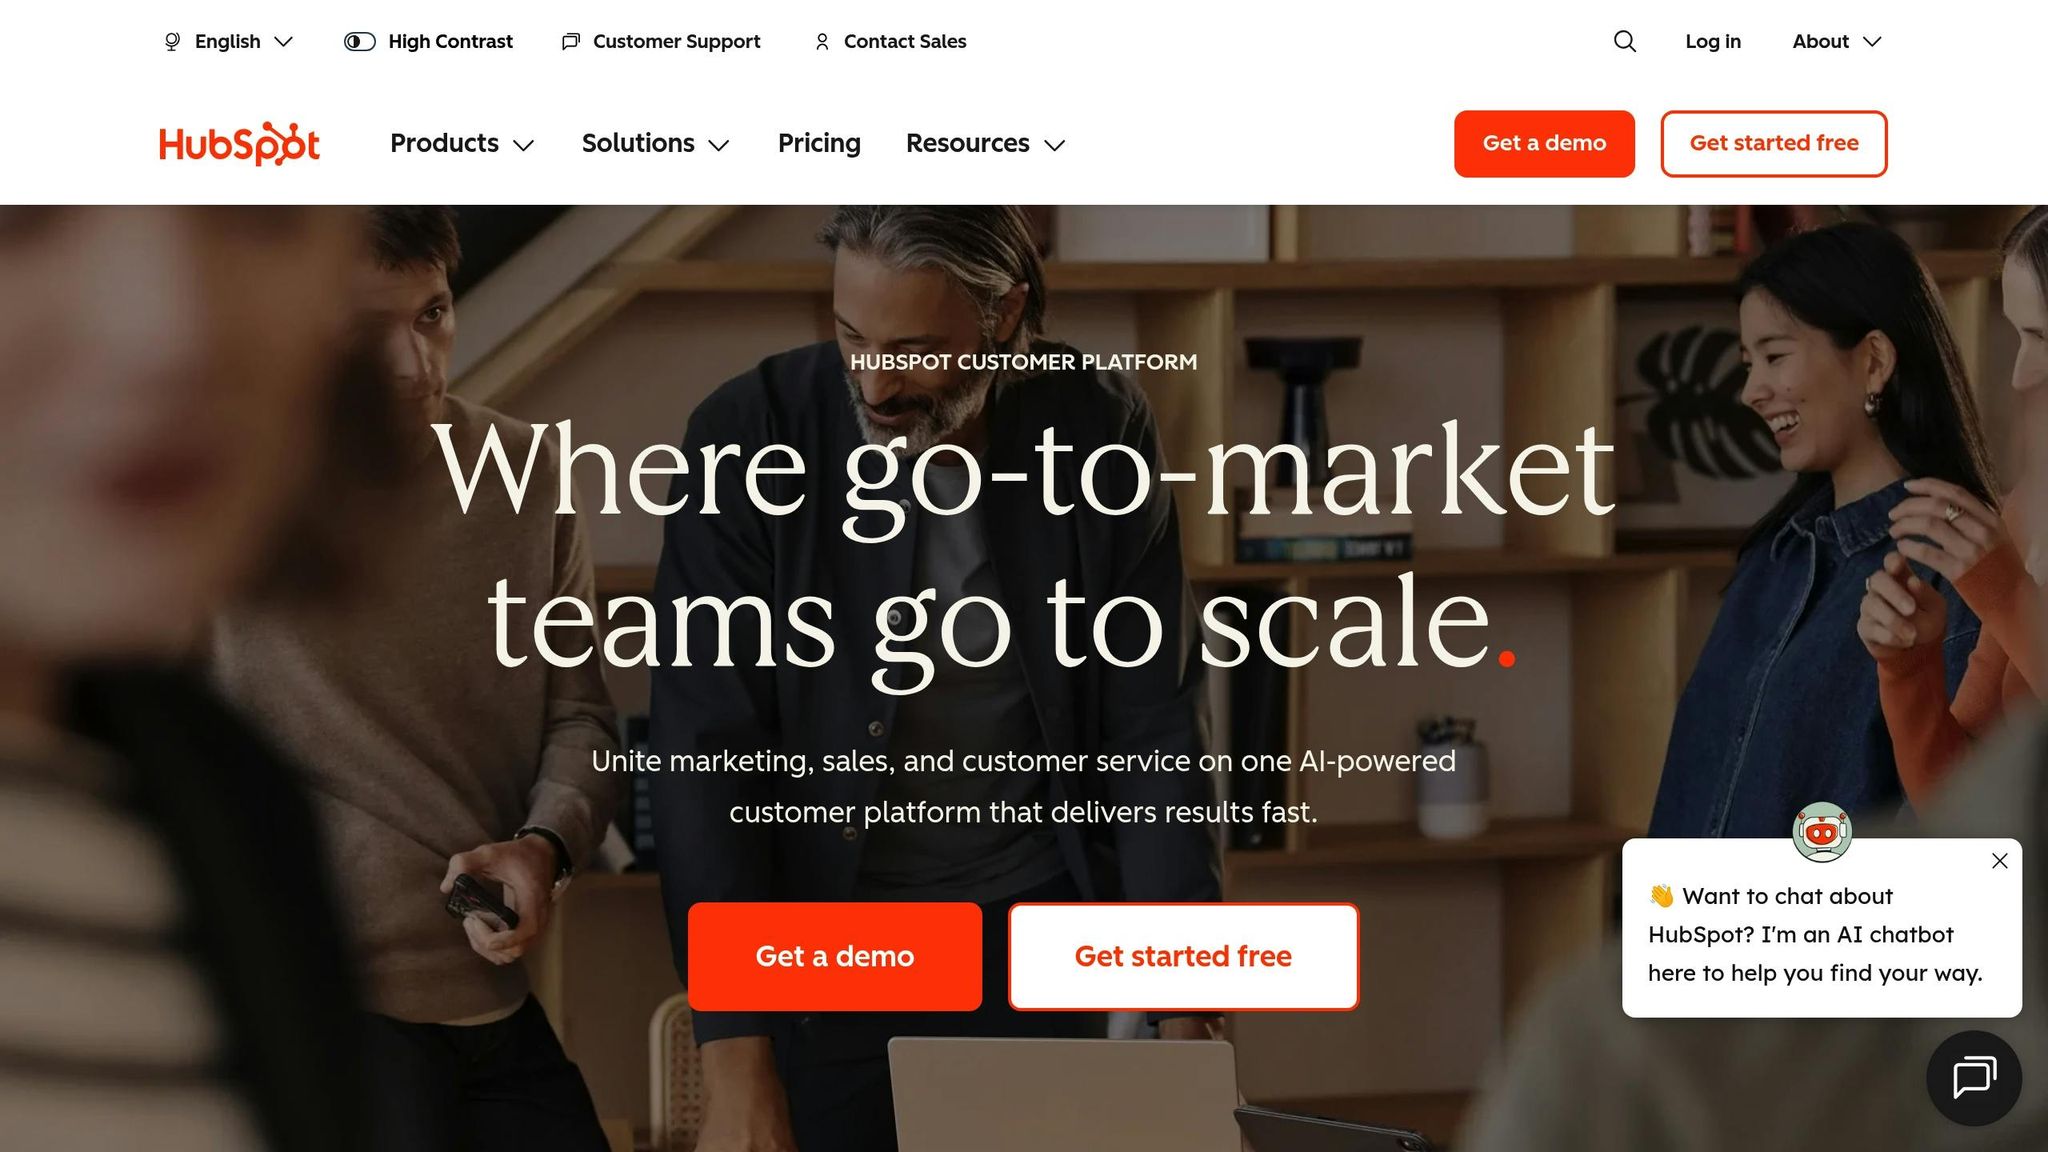
HubSpot stands out for its ability to connect content performance directly to revenue. Its Campaigns tool groups related content - like blog posts, landing pages, and email offers - so you can measure their collective impact on lead generation and revenue [6].
What sets HubSpot apart is its closed-loop reporting. This feature tracks every interaction a prospect has with your content, from reading blog posts to downloading guides. When the prospect converts, you can see exactly which content influenced their decision. HubSpot also offers multi-touch attribution models (linear, U-shaped, W-shaped) to assign credit across the buyer journey [5][6]. Plus, its integration with HubSpot CRM ensures marketing and sales data are seamlessly connected, giving you a clear view of how content drives revenue.
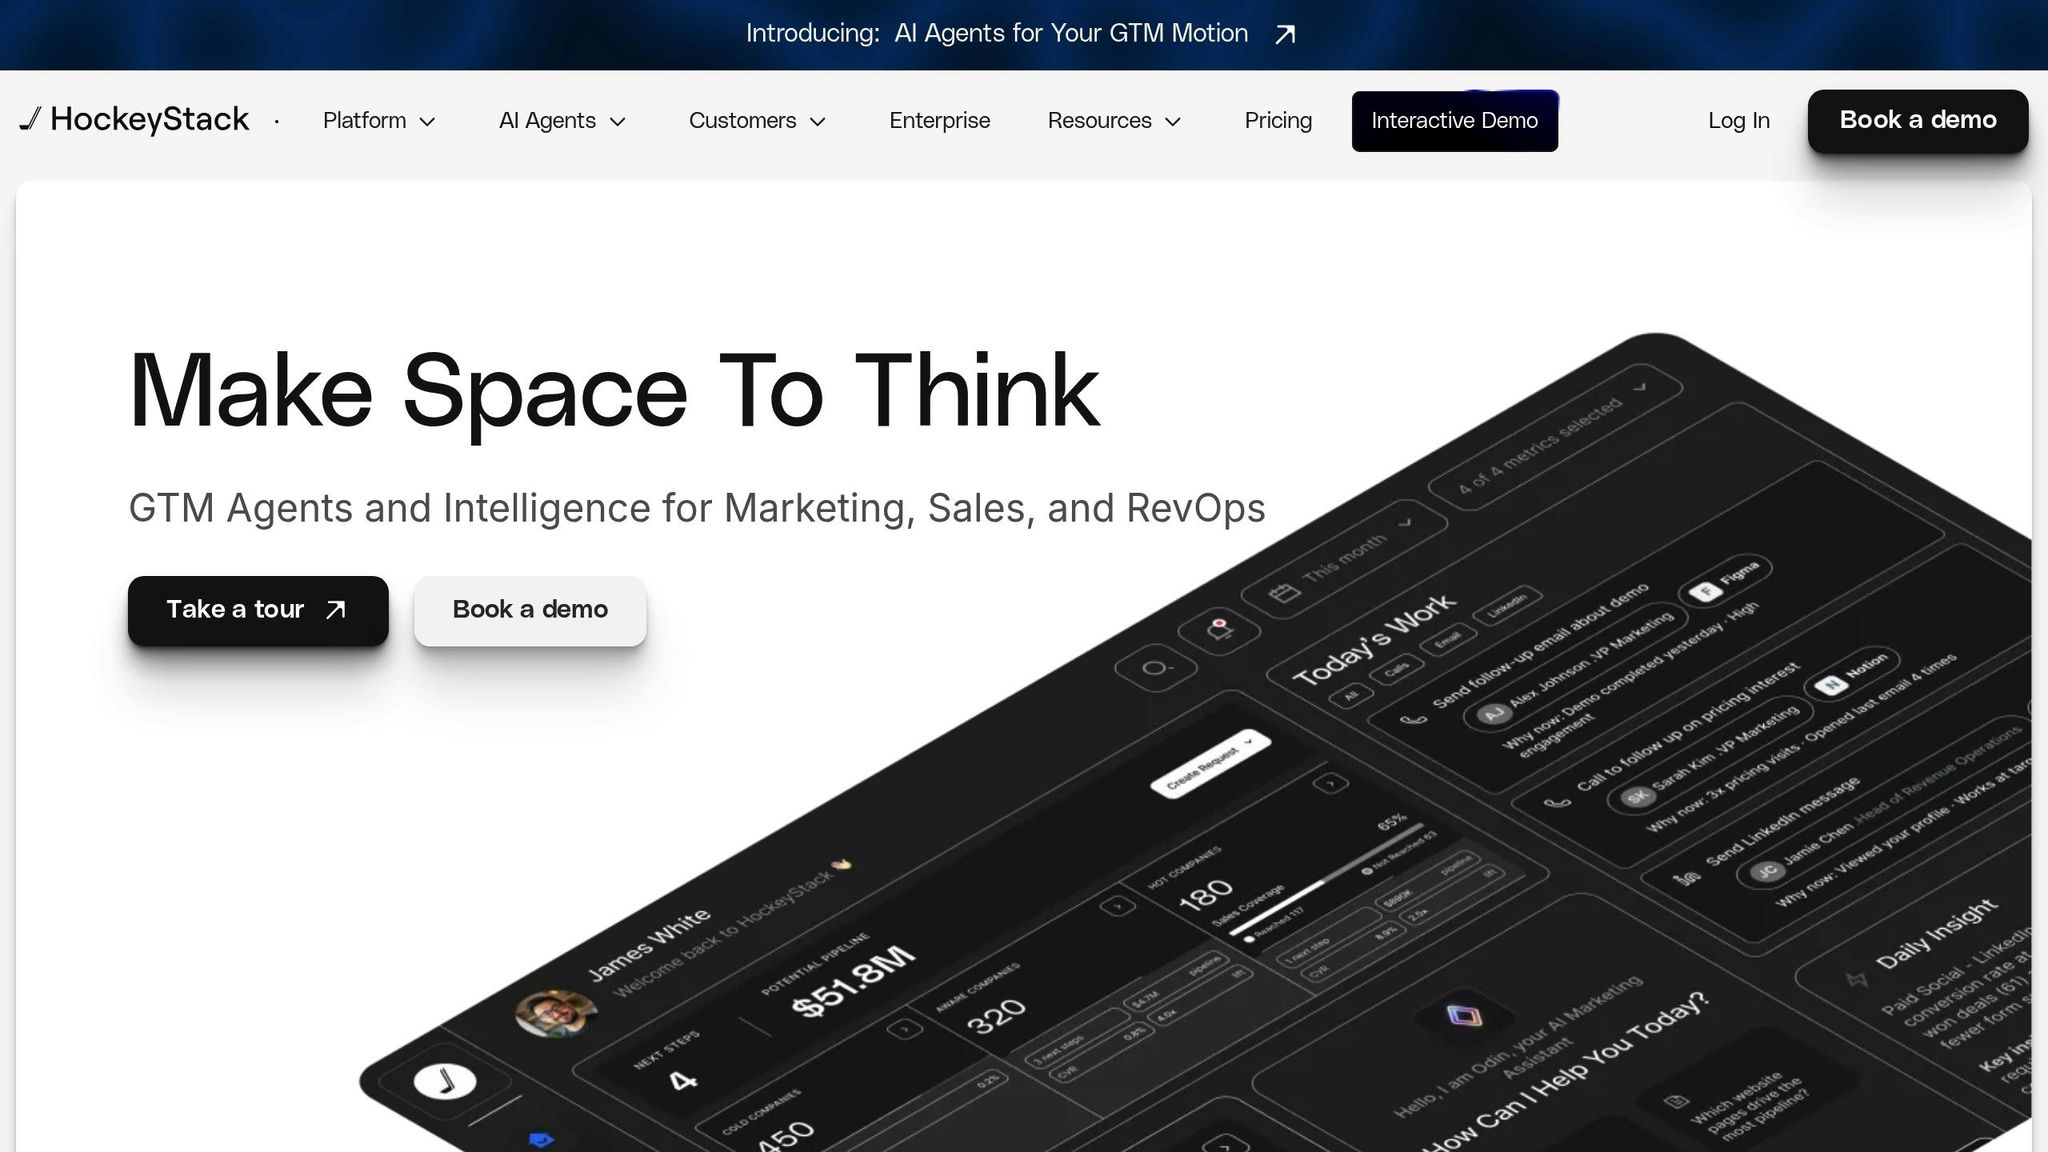
HockeyStack is tailored specifically for B2B companies with complex sales cycles. It focuses on pipeline influence and deal-level attribution [2]. This means it tracks not just opportunities created but also metrics like deal size and win rate.
One standout feature is its ability to aggregate content interactions from multiple decision-makers within a target company, providing a complete picture of how your content influences buying committees. Its AI-powered reporting also uncovers how content correlates with deal performance.
Parse.ly is ideal for content-heavy teams, offering tools to measure engagement and conversions. Its linear attribution model credits all pages viewed within 30 days of a conversion, which is particularly useful for highlighting the role of educational resources or content libraries that might not get last-touch credit [13].
The platform also tracks Engaged Time, measuring active interactions like scrolling and clicking. Additional features include content-specific conversion tracking, such as newsletter sign-ups and social shares, which can act as early indicators of content success [13].
| Tool | Primary Focus | Key Features | Best For |
|---|---|---|---|
| Google Analytics 4 | General web analytics | Model Comparison Tool, UTM analysis, event tracking, 90-day lookback | General tracking and multi-channel attribution |
| HubSpot | CRM & inbound marketing | Campaigns tool, closed-loop reporting, contact timeline, multi-touch attribution | Connecting content to CRM data and revenue |
| HockeyStack | B2B revenue attribution | Pipeline influence, deal size tracking, account-level engagement, AI reporting | B2B organizations with long sales cycles |
| Parse.ly | Content engagement | Linear attribution, Engaged Time pixel, content-specific conversion tracking | Content-heavy sites and editorial teams |
The best tool for you depends on factors like your sales cycle, content volume, and current tech stack. For beginners, GA4 is a cost-effective starting point. HubSpot is ideal for teams with mature CRM systems, while Parse.ly works well for content-driven teams. HockeyStack is perfect for B2B companies aiming to directly link content to revenue.
Beyond just tracking metrics, there are strategic ways to actively improve your content ROI.
For many B2B businesses, a CLTV (Customer Lifetime Value) to CAC (Customer Acquisition Cost) ratio of 3:1 or higher is the gold standard. In simple terms, every dollar spent acquiring a customer should bring in at least three dollars in lifetime value. To achieve this, it’s crucial to move away from vanity metrics like page views and focus on attracting high-quality leads that are more likely to convert into profitable customers. Traffic numbers are less important than ensuring that the audience you’re reaching has real potential value [2][11][15].
Content marketing, when done right, can deliver staggering results - an 844% ROI over three years, growing to 1,100% by month 36 as evergreen content continues to generate leads without additional investment [2]. To calculate CAC accurately, make sure to include all direct and indirect costs associated with customer acquisition [2][11]. Then, use retention-focused content like best practices guides, feature tutorials, and customer success stories to reduce churn and boost customer lifetime value. Attribution data can help pinpoint which content channels attract the most valuable customers, and segmenting by account tier can reveal what resonates with enterprise buyers versus mid-market prospects [11].
Real-world examples show how this approach pays off. At SAP SE, Michael Brenner (then VP of Content Marketing) tracked $100,000 in content expenses, which generated $750,000 in revenue - a 650% ROI - and brought in nearly 1,000 leads [15]. Capgemini took it even further with a storytelling website highlighting their expertise in big data and cloud solutions. In its first year, the site brought in $1 million in sales, grew to $5 million in year two, and eventually contributed $20 million annually [15].
AI is changing the game by making content strategy proactive rather than reactive. Instead of waiting to see how content performs, AI-driven predictive modeling can forecast campaign outcomes before they even launch. For instance, AI creative scoring evaluates content variants, helping you decide which ones to test live without wasting resources [16]. The results speak for themselves: AI-optimized landing pages have shown an 18% lift in conversions, while AI-first content pipelines have cut annual content spend by 30% and increased publication speed by 40% [16].
AI also detects subtle shifts in audience behavior or key performance indicators - things that might go unnoticed with manual analysis. This allows for real-time adjustments to your strategy [3]. Predictive scoring can even evaluate multiple headlines or test semantic coverage before campaigns go live. To measure the impact of AI, tag all AI-assisted content in your CMS and compare its performance against content created without AI [16]. In email marketing, companies using AI-driven personalization report that behavior-triggered campaigns account for 77% of total email ROI [17].
These AI tools lay the groundwork for more integrated approaches, such as Visora’s Trifecta Program.

Taking content ROI optimization to the next level, Visora’s Trifecta Program combines advanced technology with expert strategy in a 12-week system. This program is designed to tackle the complexity of B2B sales, which often involve 100+ touchpoints over 6–18 months [2][5]. It integrates sophisticated attribution models and intent signal tracking to ensure every piece of content contributes to revenue goals.
One standout feature is the B2B Vortex Funnel, which creates personalized content pathways based on buyer intent signals. By connecting anonymous visitor behavior to known leads in your CRM, it tracks which specific pieces of content influence decision-makers within target accounts. This is especially important for navigating the dynamics of large buying committees. Another layer, AI-Augmented Appointment Setting, uses predictive modeling to identify high-intent prospects and automate multi-channel outreach. Finally, DD Strategy Consulting ensures that your content strategy stays aligned with revenue objectives rather than vanity metrics.
These advanced techniques, when implemented together, can transform how businesses approach content marketing and drive measurable results.
Tracking B2B content ROI is no longer just a nice-to-have - it's essential for driving sustainable growth. Yet, a surprising number of marketers and companies still fall short, with 42% of B2B marketers and 44% of companies failing to measure ROI effectively [2][5]. The winners are those who move beyond surface-level metrics like page views and social shares, instead focusing on metrics that truly matter: pipeline influence, LTV:CAC ratios, and revenue attribution.
By combining multi-touch attribution with AI-powered analytics, businesses can uncover how their content directly impacts revenue. Integrating CRM systems with marketing automation and analytics tools allows you to map a lead's journey from an anonymous visitor to a closed deal. This isn't just about proving marketing's worth to the CFO - it’s about identifying which content assets are worth further investment and which ones are draining resources. Poor attribution can lead to 20%–40% of your budget being wasted [5]. A unified view of content performance ensures that every interaction is accounted for, setting the stage for sustained growth.
Content marketing also offers compounding benefits over time. Unlike paid ads that stop delivering as soon as the budget runs out, evergreen content continues generating leads. While the initial ROI might seem modest, well-measured, long-term content can deliver an 844% ROI over three years, climbing to 1,100% by Month 36 [2]. This highlights the importance of tracking performance over the entire lifecycle, not just in the short term.
For those looking to take their efforts to the next level, Visora's Trifecta Program offers a 12-week system designed to turn attribution insights into revenue growth. This program combines the B2B Vortex Funnel for creating personalized content journeys, AI-Augmented Appointment Setting for identifying high-intent prospects, and DD Strategy Consulting for aligning revenue goals. It’s not just about measuring ROI - it’s about ensuring every piece of content contributes to tangible business outcomes.
The path forward is clear: build a solid infrastructure, adopt effective attribution models, and focus on metrics that drive revenue. Organizations that master content ROI measurement today will position themselves for a strong competitive edge in the future.
Measuring ROI for B2B content marketing means focusing on metrics that connect your content directly to business results. Two standout indicators are lead quality and conversion rates, which help you see how effectively your content attracts and engages the right audience. Beyond that, metrics like pipeline contribution and revenue impact give you a clear picture of how your content supports sales and drives growth.
You might also want to track Customer Acquisition Cost (CAC) and Customer Lifetime Value (LTV) to understand the financial efficiency of your efforts. Long-term factors, such as building brand authority and earning audience trust, are equally important. To get a full picture, consider using multi-touch attribution models. These models show how your content influences buyers at different stages of their journey. When you align these metrics with your business goals, it becomes much easier to show the impact of your content marketing.
Multi-touch attribution models give B2B marketers a clearer picture of how different customer interactions contribute to conversions and revenue. Unlike single-touch models - which assign credit to just the first or last interaction - multi-touch attribution spreads the value across multiple touchpoints throughout the buyer's journey. This approach helps pinpoint which content and channels work best, allowing marketers to allocate budgets more wisely and focus on efforts that deliver the biggest impact.
Using these models, businesses can fine-tune their content strategies with actionable data. For instance, if certain touchpoints consistently drive conversions, you can create more targeted content that connects with your audience. On top of that, multi-touch attribution highlights the measurable impact of content marketing by linking specific efforts directly to revenue. This makes it easier to justify spending and refine future campaigns. In short, it ensures your resources are going toward strategies that truly drive growth.
Measuring the ROI of B2B content marketing takes the right mix of tools and strategies. Analytics platforms, like Google Analytics, play a key role in tracking traffic sources, audience engagement, and conversion rates across different channels. These insights help you understand where your audience is coming from and how they're interacting with your content.
Social listening tools add another layer by offering insights into brand mentions, audience sentiment, and campaign reach. They help you measure how well your content resonates and the broader impact of your marketing efforts.
If you’re looking to connect your content directly to revenue, attribution systems are worth considering. These tools map out the buyer's journey by tracking multiple touchpoints, showing how your content influences decisions along the way. For a more focused view, content performance dashboards with clear KPIs - like lead quality and cost efficiency - can guide you in aligning your content strategy with your business goals.
Ultimately, the tools you use should match your campaign objectives, providing a clear view of performance from the first interaction to revenue generation.
%20(5).png)
