%20Bold.png)
ROI metrics are essential for understanding the effectiveness of business development efforts in financial B2B. These metrics help measure the return on investments in areas like marketing, sales, and client acquisition, especially in industries with long sales cycles and complex buyer journeys.
Key takeaways:
(Revenue - Cost) / Cost x 100. For example, spending $10,000 to generate $50,000 results in a 400% ROI.For financial B2B, ROI metrics provide clarity on which strategies drive revenue and help refine investments for better results. Aiming for a 5:1 ROI ratio is considered solid, while 10:1 is outstanding.

Essential ROI Metrics for Financial B2B Business Development
Now that we've outlined the basics of revenue, cost, and time, let's dive into the key ROI metrics that matter most in financial B2B development.
CAC tells you how much you're spending to bring in each new client. To calculate this, divide your total sales and marketing expenses - things like ad spend, software fees, team salaries, and CRM costs - by the number of new customers you’ve gained during a specific period [4][6]. Many financial B2B firms aim to keep CAC between 10% and 33% of their Customer Lifetime Value (CLV) [4][5].
Joe Anderson, CEO of Pure Financial Advisors, shares this perspective:
"We have seen a remarkable return on investment and comparatively low client acquisition costs even as we've multiplied our spend over the years." [6]
CLV measures the total revenue a client brings over the course of their relationship with your business. In financial services, this is typically calculated by multiplying the average sale value by the number of repeat transactions and the average retention period [4].
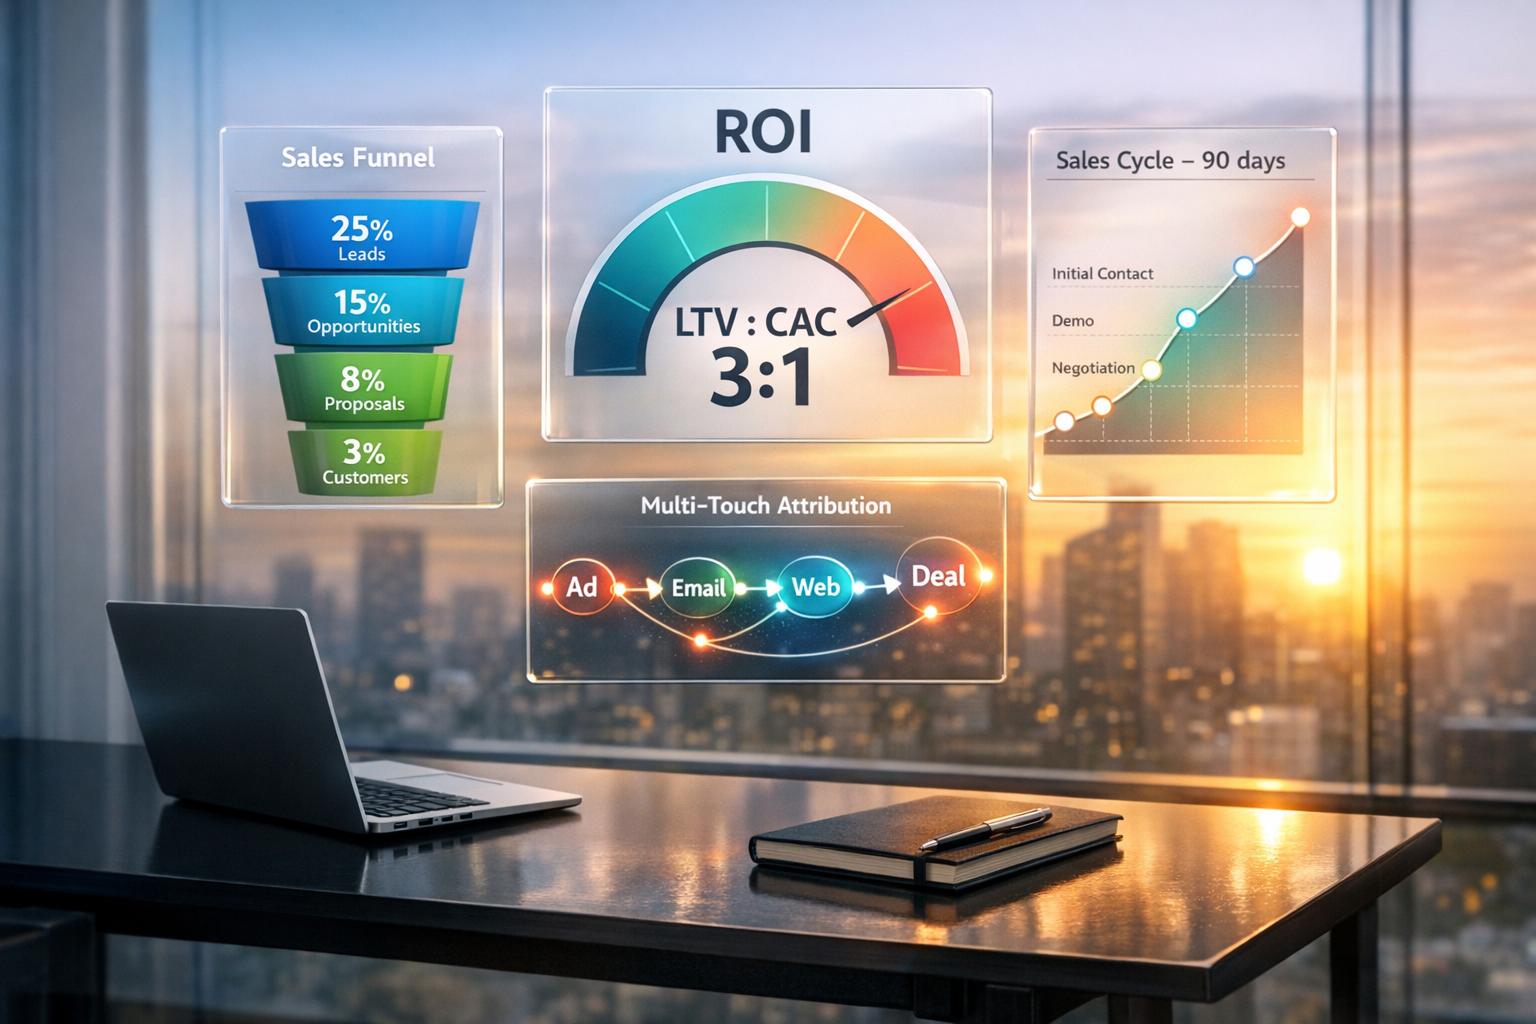
One important benchmark to track is the LTV:CAC ratio. A healthy financial B2B business generally aims for a ratio of around 3:1 - meaning every dollar spent on acquiring a client should ideally generate three dollars in return [4][5]. If your ratio drops below 2.5:1, it might signal high acquisition costs or issues with client retention and service.
Understanding the length of your sales cycle and how prospects move through your funnel is critical for refining ROI in financial B2B development [2][7]. Sales cycles in this field often stretch over months or even years. For instance, the average cold call dial-to-booked-meeting conversion rate is just 2.3%, but this jumps to 65.6% once a live conversation is established [7].
Improving data quality to better target decision-makers can significantly boost ROI. Take the time to analyze performance by list source, industry, and buyer persona. This helps you zero in on high-performing segments while fine-tuning underperforming channels [7].
Understanding what drives ROI is crucial for making smart investment choices. In the world of financial B2B business development, three factors play a major role: the size and structure of your deals, the efficiency of your sales and marketing processes, and the accuracy of your targeting and messaging. Let’s break down how each of these impacts ROI.
When it comes to ROI, bigger deals often mean better returns. Why? Larger deals can support higher acquisition costs since the revenue per account is significantly higher. For instance, a single client might sign a multi-year contract worth hundreds of thousands - or even millions - of dollars. This is why 73% of marketers say account-based marketing (ABM) helps increase deal size, as it prioritizes high-value accounts over sheer volume [10].
Long-term contracts also add more value over time, with revenue continuing to flow in months or even years after the initial agreement [2].
Michael Warford, a Content Writer and Marketing Specialist at Directive Consulting, sums it up well:
"ABM RPA should exceed non-ABM RPA since ABM is usually targeted at higher-value accounts." [9]
To measure success, track Revenue per Account (RPA) for ABM-focused versus non-ABM accounts. If your ABM accounts aren’t generating significantly higher revenue, it might be time to revisit your targeting strategy or rethink your deal structures.
Even with strong deal potential, ROI can take a hit if your sales and marketing processes aren’t efficient. Streamlining these operations not only cuts costs but also speeds up how quickly prospects convert into customers. On the flip side, when sales and marketing teams work in silos, resources get wasted, and opportunities can slip through the cracks [2].
Timing is everything. Leads contacted within 5 minutes are 21 times more likely to qualify than those reached after 30 minutes [10].
Efficiency starts with clean, reliable data. Techniques like identity resolution and deduplication can increase match rates by 15%–25% [12]. This ensures your CRM gets accurate data, which prevents distorted ROI models down the line [12].
Automation is another game-changer. Tools like company blogs or ROI calculators can handle early prospecting tasks, answering common questions and freeing up your sales team to focus on high-priority leads [1]. Automated lead nurturing campaigns can also generate 75% more revenue compared to leads that aren’t nurtured [8].
Ellie von Reyn, Senior Director of Demand Generation at Conductor, explains their strategy:
"At Conductor, we rely on a multi-touch attribution model. By being able to report on every step in the customer journey, we're able to get specific insights on which content, campaigns, and website pages are impacting that journey - providing the data needed to maximize ROI by investing in the efforts that drive customers further down the funnel." [2]
Precision targeting is essential for boosting ROI, especially in financial B2B. Here, quality beats quantity every time. ABM strategies focus on accounts that match your ideal customer profile, leading to larger deals and higher conversion rates [10]. In fact, B2B marketers using account-based tactics report 81% higher ROI compared to those relying on traditional methods [10].
Tailored messaging also plays a big role. By addressing specific pain points, industries, or decision-maker roles, you can improve conversion rates significantly.
Segmenting audiences based on intent signals is another way to allocate your budget wisely. For example, someone who downloads a pricing guide shows much stronger buying intent than someone who simply reads a blog post [12]. While the average cost per lead in B2B is around $200, high-intent demo requests for complex services can range between $600 and $800 [10]. These higher costs are worth it when the potential deal size and lead quality are significantly better.
Lastly, track your Marketing Qualified Lead (MQL) to Sales Qualified Lead (SQL) conversion rate. A healthy range is typically 10% to 30% [10]. If your conversion rates are falling short, it could signal a mismatch between your targeting efforts and your ideal customer profile - or a disconnect in your messaging.
Advanced attribution models are game-changers when it comes to understanding the impact of every interaction in a buyer’s journey. In financial B2B, where the road to a closed deal is often anything but straightforward, this insight is crucial. With buyers averaging 36 interactions before making a purchase decision [14], and sales cycles that can stretch 6 to 12 months or more [11], pinpointing the touchpoints that truly drive revenue is essential. Multi-touch attribution and data-driven insights provide the clarity you need to allocate resources effectively.
Traditional single-touch attribution models, whether they focus on the first or last interaction, fail to capture the complexity of modern B2B buyer journeys. Multi-touch attribution (MTA), on the other hand, spreads credit across the key milestones, offering a more accurate picture [11].
Emir Atlı, CRO at HockeyStack, highlights this limitation:
"The main problem with traditional ROI frameworks is that they tend to reduce months of sophisticated marketing work into oversimplified figures that ignore how B2B deals actually close." [11]
Different MTA models serve different purposes. For instance:
The trick lies in aligning the attribution model with your sales process. Start by mapping out the typical number and type of interactions leading up to an opportunity. Experiment with different models to determine which one aligns best with your actual deal patterns [11]. Keep your CRM and marketing automation tools in check by regularly auditing for duplicate entries and correcting tags, ensuring your data stays clean and reliable [2][16].
Once you’ve established a reliable attribution framework, the next step is turning those insights into actionable strategies.
When your attribution model reflects the buyer’s journey accurately, it opens the door to smarter, more informed decision-making. Financial B2B leaders who monitor both leading indicators (like MQL-to-SQL conversion rates and engagement across multiple stakeholders) and lagging indicators (such as closed-won revenue and customer lifetime value) can identify trends early and adjust course before issues arise [11][15].
Chris Speicher, Co-owner of The Speicher Group, underscores the importance of this approach:
"If you don't know where you're spending your money, and what the return on that investment is, you're not really running a business, you're just guessing." [16]
Integrate tools like CRM, marketing automation platforms, and analytics software to create a unified view of the customer journey [13][11]. This consolidated approach helps pinpoint which channels provide the highest ROI and highlights areas where returns are diminishing. For instance, if email marketing generates $36 for every $1 spent [11], while another channel barely breaks even, you’ll know where to shift your budget.
Don’t overlook offline interactions like trade shows, phone calls, or in-person meetings. Use tools like call tracking, unique meeting links, and custom CRM fields to capture these high-value touchpoints [11][16]. Pair system-based tracking with self-reported insights by simply asking customers, "How did you hear about us?" This can help uncover less visible influences, such as referrals or discussions happening in "dark social" spaces [15].
Visualizing this data is just as important. Dashboards with trend lines and funnel views make it easier to spot patterns and act quickly [11][15]. Regular reporting - whether weekly, monthly, or quarterly - keeps your team aligned and ensures timely adjustments [11][15].
Tracking ROI metrics without tying them directly to your business goals is like gathering data without a purpose - it doesn’t lead anywhere useful. For financial B2B companies, where sales cycles can stretch from 6 to 12 months and involve multiple decision-makers, this lack of alignment can be particularly expensive. Every metric you monitor should connect to a clear, measurable objective, whether that’s expanding your pipeline efficiency, speeding up deal closures, or cutting acquisition costs[15].
Before diving into any initiative, define what success looks like. Instead of vague aims like "increase brand awareness", set specific goals, such as "achieve a 20% increase in qualified loan applications within six months"[3]. Your KPIs should reflect the complexities of financial B2B sales. For instance, don’t stop at counting leads - track deeper metrics like application starts, completed applications, and funded loans or assets under management[3]. A strong financial services business often targets a Customer Lifetime Value (CLV) that’s at least three times higher than the Customer Acquisition Cost (CAC)[3].
Ashish Shetty, a B2B Growth Strategist at DigitalScouts, emphasizes this point:
"Measurement is not just a reporting exercise; it's a foundation for smarter decision-making."[15]
To make the most of your efforts, break down ROI by channel - SEO, PPC, email, events - so you can identify which ones deserve more investment[3]. Real-time dashboards in your CRM or ERP system can help you monitor these KPIs and make adjustments immediately, rather than waiting for quarterly reviews[17][18].
Once your KPIs are in place, it’s essential to track both predictive and outcome-based indicators for a complete picture of ROI performance.
To fully understand your performance, you need to measure both leading and lagging indicators. Leading indicators - like MQL-to-SQL conversion rates, sales-ready opportunities, and engagement levels within target accounts - help predict future success[11][15]. On the other hand, lagging indicators, such as closed-won revenue, Customer Lifetime Value, and Net Revenue Retention, confirm the results of past strategies[11][15].
Balancing these two types is critical. Leading indicators allow you to spot problems early. For instance, if your MQL-to-SQL conversion rate drops from 15% to 8%, it might signal an issue with lead quality that needs immediate attention. Lagging indicators, meanwhile, validate the long-term impact and profitability of your strategies[15][17].
| Indicator Type | Examples for Financial B2B | Purpose |
|---|---|---|
| Leading | MQL volume, sales-ready opportunities, account engagement score, email open rates | Predicts future pipeline and highlights process issues[15][17] |
| Lagging | Closed-won revenue, Customer Lifetime Value (CLV), Net Revenue Retention (NRR), funded loans | Measures long-term profitability and growth sustainability[15][17] |
Documenting clear goals has been shown to boost marketing success rates by 377%[20]. Additionally, improving customer retention by just 5% can increase profits by 25% to 95% for B2B businesses[20].
Consistent evaluation is key. Review your metrics monthly or quarterly to identify opportunities for reallocating resources from underperforming to high-performing channels[3][19]. Every report should drive actionable decisions - whether it’s tweaking campaign messaging, shifting ad budgets, or refining your lead scoring model[11].
Tailor your reporting to suit different audiences. For example, create executive dashboards for board-level insights, program-level reports for investment decisions, and operational reports for day-to-day optimizations[11]. Use a continuous improvement cycle - Measure → Analyze → Test → Learn → Scale - to systematically enhance ROI over time[3]. For instance, if you discover that personalized email campaigns increase ROI by up to 20%[3], you can test variations, measure their impact, and expand on what works.
In financial marketing, an ROI ratio of 5:1 (500%) is generally considered solid, while a 10:1 ratio (1,000%) is exceptional[3][2]. Keep in mind that new sales reps usually take about nine months to reach full productivity and 15 months to become top performers[18]. Factor this ramp-up period into your ROI calculations and planning. The goal isn’t to achieve perfection immediately but to establish a strong baseline and gradually improve over time[20].
ROI metrics are the cornerstone of smarter decision-making in financial B2B business development. In a space where sales cycles often span 6 to 12 months and involve multiple stakeholders, knowing which strategies drive actual revenue is what sets successful firms apart from those spinning their wheels. As Daiana Altinay from LeadNBFI puts it:
"If you're not measuring your marketing ROI, you're essentially throwing money into the wind and hoping it lands somewhere useful" [3].
Tracking key metrics like Customer Lifetime Value (CLV) and Customer Acquisition Cost (CAC) allows firms to justify long-term investments in relationship-building, which leads to sustainable growth. This highlights the importance of consistently monitoring ROI across all initiatives.
To ensure sustainable growth, aim for a CLV that's at least three times your CAC [3]. Multi-touch attribution models can provide a clearer picture of how different touchpoints - such as webinars, email campaigns, and LinkedIn interactions - contribute to closing deals, rather than attributing success to just the first or last interaction.
When calculating ROI, don’t forget to account for hidden costs. Expenses like staff time, software subscriptions, content creation, and compliance reviews can inflate your actual CAC by 20–30% [3]. Set clear, measurable goals for each channel, such as "increase qualified loan applications by 20% within six months" or "secure one new client per quarter through referral partnerships." For example, Pure Financial Advisors achieved $1.0 billion in new Assets Under Management by leveraging investor referrals from the SmartAsset AMP platform while maintaining low acquisition costs [6].
Balance your reporting with both leading indicators (like MQL-to-SQL conversion rates and engagement metrics) and lagging indicators (like closed-won revenue). This dual approach helps you identify potential issues early while confirming long-term profitability.
Start with a 30-60-90 day plan to refine your strategy. In the first 30 days, implement UTM tracking for all digital campaigns and ensure your CRM accurately captures lead sources. By day 60, analyze the data to pinpoint which channels deliver the highest-quality leads at the lowest CAC. By day 90, focus your budget on high-performing initiatives and cut back on underperforming ones [21].
Integrate your CRM with marketing automation tools to unify reporting and track the entire customer journey, from initial contact to closed deals. For complex B2B sales cycles, extend your attribution window to 90–180 days instead of the standard 30 days, ensuring you capture the full buyer journey [21]. Schedule monthly or quarterly ROI reviews to make data-driven adjustments rather than relying on instinct.
As a benchmark, a 5:1 ROI ratio (500%) is generally considered solid for financial marketing, while a 10:1 ratio (1,000%) is exceptional [3]. By adopting these strategies, your firm can establish a reliable framework for achieving sustainable, profitable growth in an increasingly competitive landscape.
Multi-touch attribution plays a crucial role in boosting ROI for financial B2B sales by giving credit to all the important interactions a prospect has with your brand throughout their journey. Instead of focusing on just one touchpoint, this method tracks and evaluates the influence of each step, helping businesses pinpoint which interactions are driving conversions. The result? Smarter resource allocation and sharper marketing strategies.
When companies understand how each interaction contributes to the bigger picture, they can fine-tune their campaigns and sales efforts. This leads to greater efficiency and measurable ROI gains - often in the range of 15–30%. For industries like financial B2B, where sales cycles are long and intricate, these insights are game-changing.
When it comes to measuring ROI, leading and lagging indicators serve different purposes and operate on distinct timelines.
Leading indicators are all about looking ahead. These metrics help predict future performance and guide adjustments to your strategies before the results are set in stone. Think of things like website traffic, engagement rates, and early signs of conversions. They’re like a compass, showing where you’re headed and helping you course-correct if needed.
On the flip side, lagging indicators tell the story of what’s already happened. They reflect the outcomes of your efforts, offering a clear picture of past performance. Metrics such as revenue, profit margins, and customer retention rates fall into this category. They’re essential for validating success and understanding the tangible results of your strategies.
By combining both types of indicators, you get a complete view of your performance. Leading indicators highlight areas for improvement, while lagging indicators confirm what’s working and measure the results you’ve achieved.
The LTV to CAC ratio plays a crucial role for financial B2B businesses as it measures the relationship between a customer's lifetime value (LTV) and the cost of acquiring that customer (CAC). Essentially, it’s a way to gauge how effectively your business turns customer acquisition efforts into long-term profits.
A healthy LTV:CAC ratio shows that your sales and marketing strategies are delivering worthwhile returns. On the other hand, a weak ratio could indicate the need to rethink how resources are being allocated to achieve better profitability. For financial B2B companies, where acquisition costs often run high, keeping this metric in check is key to building cost-efficient and scalable growth strategies.
%20(5).png)
