%20Bold.png)
Social media in financial B2B isn't about going viral or racking up likes. It's about reaching decision-makers, building trust, and driving revenue. With long sales cycles and complex buying processes, focusing on the right KPIs ensures your efforts contribute to business goals. Here's what matters most:

Social Media KPI Framework for Financial B2B Companies
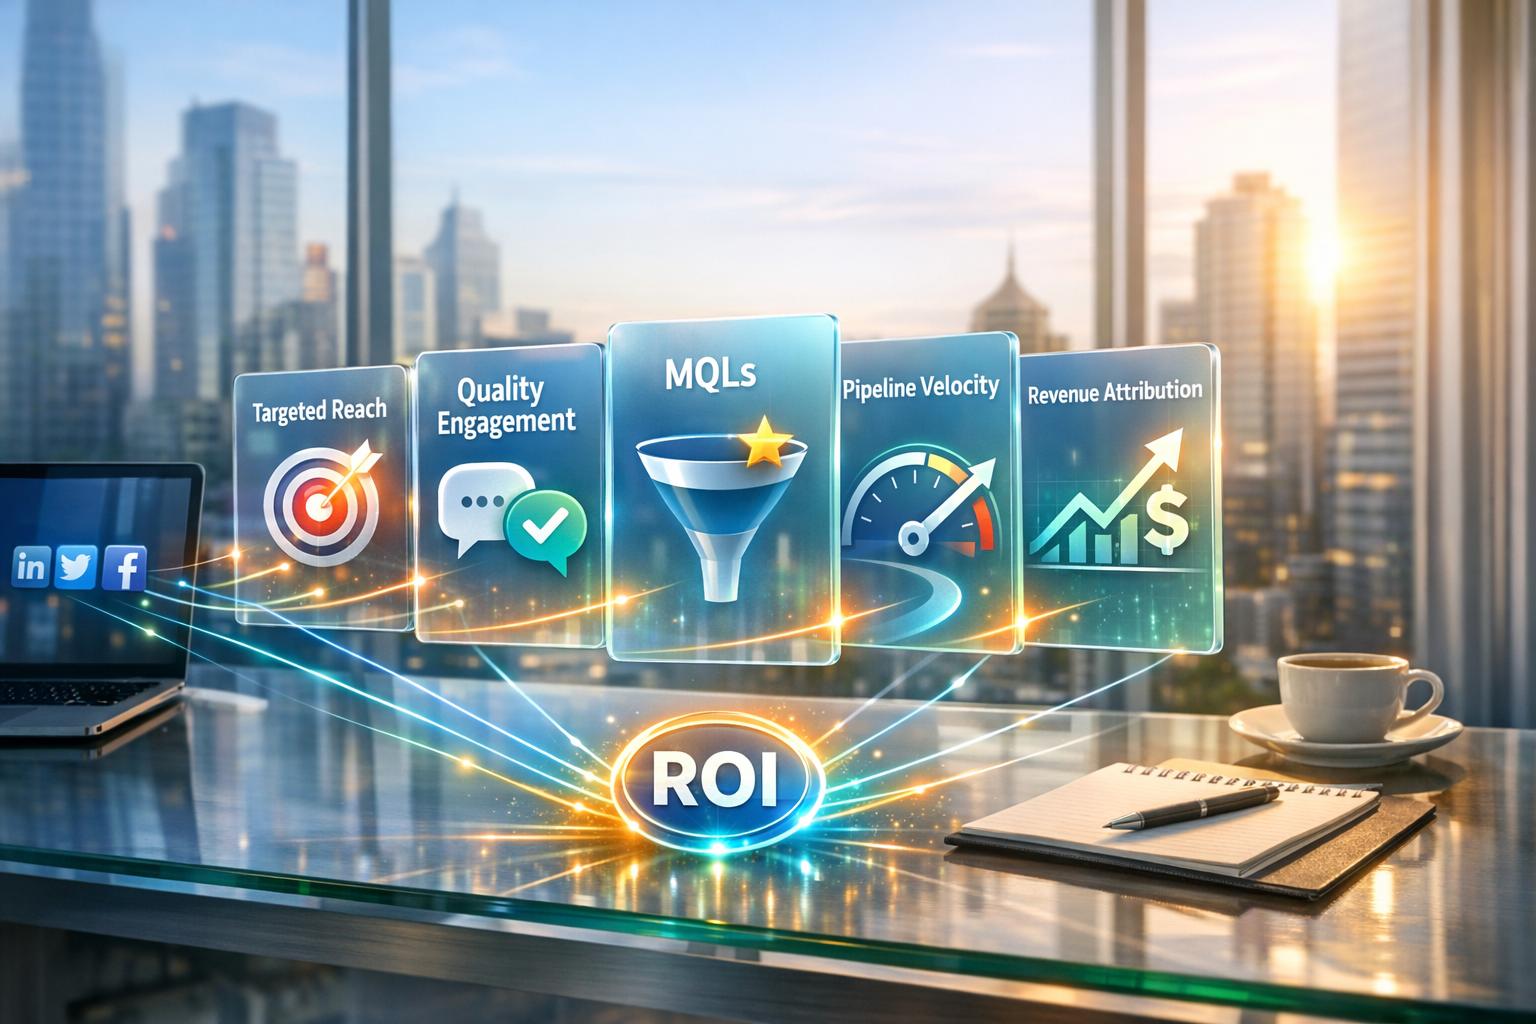
For financial B2B firms, understanding which social media metrics directly connect to business outcomes is essential. The framework below organizes key performance indicators (KPIs) into four categories, aligning with the buyer's journey - from initial awareness to long-term retention.
Unique Reach tracks the number of individual viewers exposed to your content. For financial B2B firms, it’s important to filter this metric to focus on qualified prospects, such as specific decision-makers.
Share of Voice (SOV) measures how often your brand is mentioned compared to competitors. For example, if your firm is being discussed in conversations about regulatory compliance or financial technology, a higher SOV indicates growing authority in these areas. This can strengthen brand recall during the consideration phase [1].
Targeted Reach ensures your content reaches the right professionals - those in specific industries, roles, or seniority levels. Tools like LinkedIn's Visitor Analytics can provide insights, such as whether C-suite executives from target accounts are engaging with your content. This is a critical indicator that your messaging resonates with decision-makers [2].
Once you've established reach, the next step is fostering deeper engagement and building relationships.
Reaching the right audience is just the start. Building meaningful engagement is crucial in financial B2B, where trust is everything. Metrics like Comment Quality and Saves are more insightful than simple likes. For instance, when a prospect asks a thoughtful question or saves a post for later, it shows growing trust and professional relevance [1].
"Engagement is a signal, not a goal. What happens after someone interacts matters most." - WSI World [2]
Amplification Rate measures how often your audience shares your content, extending its reach. In financial services, it’s valuable to track not just the volume of shares but also the influence of the individuals sharing your posts [2].
Conversation Rate looks at the percentage of viewers who leave meaningful comments. This metric helps determine if your content sparks dialogues that could lead to long-term relationships - especially important in industries with extended sales cycles.
After engagement, the focus shifts to converting interest into opportunities. Marketing Qualified Leads (MQLs) represent prospects who meet criteria like job title, company size, or industry. These leads often demonstrate interest by actions such as downloading a whitepaper or attending a webinar. For example, one $12M firm discovered that 34% of new client acquisitions came from social-sourced MQLs, with a much lower acquisition cost ($3,200 compared to $28,600) [6].
Cost Per Lead (CPL) evaluates how efficiently your social media spend generates qualified prospects. Firms using strategic social media programs often see acquisition costs 40% to 60% lower than those relying only on outbound marketing [6].
Pipeline Velocity tracks the speed at which social-influenced leads move through the sales funnel. For financial B2B firms, where sales cycles can last six to 18 months, credibility built early through social media can accelerate deal progression. For instance, a mid-market SaaS company spent $47,000 over 12 months on educational content and executive positioning, generating 342 qualified opportunities worth $4.1M in pipeline value. This led to 78 closed deals and $1.2M in new annual recurring revenue [6].
Click-Through Rate (CTR) to high-value content like case studies or demo requests reflects intent. Using UTM parameters to track CTR allows you to identify top-performing content and refine campaigns [6].
After conversions, the final step is measuring how social media impacts revenue and retention.
Revenue-focused metrics show how social media drives financial outcomes. Revenue Attribution directly links social media efforts to closed deals. For example, an industrial equipment manufacturer credited 43 closed deals and $2.8M in revenue to LinkedIn content, achieving a 412% ROI over 18 months [6]. Integrating social media tools with CRM platforms like Salesforce is key to tracking this journey from first interaction to signed contract.
Customer Lifetime Value (CLV) evaluates whether clients acquired via social media generate more long-term revenue compared to other channels. Financial B2B firms often find that clients engaged with thought leadership before purchasing tend to stay longer and expand their relationships. Monitoring the LTV:CAC ratio for social-sourced customers helps assess profitability over time [6][7].
Referral Rate measures how often clients acquired through social media recommend your firm. In financial services, trust and reputation are critical. If a client discovers your firm through LinkedIn and later refers others, it highlights the compounded value of social media. Tracking referrals within the first 12 to 24 months provides actionable insights [6].
| KPI Category | Key Metrics to Track | Business Importance |
|---|---|---|
| Awareness | Unique Reach, Brand Mentions, SOV | Measures brand authority and visibility |
| Engagement | Comment Rate, Saves, Amplification | Reflects content relevance and trust-building |
| Conversion | MQLs, CPL, Click-Through Rate | Tracks efficiency in turning interest into intent |
| Revenue | Pipeline Velocity, Revenue Attribution, LTV:CAC | Demonstrates direct financial impact on the business |
Focusing on the KPIs that align with your revenue objectives - and tracking them consistently - can set you apart. Since only 23% of B2B companies currently have the infrastructure to measure social media ROI accurately [6], building this capability can give your firm a strong edge in showcasing social media's impact on the bottom line.
Before diving into metrics, it’s essential to define your social media objectives clearly. For instance, if your goal is to build brand awareness in a new market, focus on metrics like Share of Voice and Targeted Reach. On the other hand, if your priority is generating leads, track Marketing Qualified Leads (MQLs) and Sales Qualified Opportunities (SQOs). The secret is to align your KPIs with your business goals for the quarter [4].
Using the SMART framework (Specific, Measurable, Achievable, Relevant, and Timely) ensures your KPIs are actionable. Map these metrics to different stages of the customer journey:
Given that 58% of marketers need to prove social media ROI to justify budgets, tying KPIs directly to business results is a must [1].
Collaboration is key. Work with leadership to create a KPI framework that everyone agrees on. A shared glossary defining each KPI, how it’s measured, and its purpose can eliminate confusion and keep teams aligned [8]. For many B2B firms, Sales Qualified Opportunities are the clearest indicator of potential revenue. As Liam Bartholomew, Global Head of Demand Generation at Cognism, puts it:
"An SQO is a sales rep, saying, 'I think this could close,' and you want to be generating as many of those as possible" [7].
Once your KPIs are in place, the next step is setting up systems to track them effectively in real time.
Defining KPIs is only half the battle - tracking them accurately is where the magic happens. Start by using UTM parameters for every link shared on social platforms. These codes allow tools like Google Analytics to pinpoint which specific posts or campaigns drive traffic to your website, making it easier to attribute conversions [8][2]. Multi-touch attribution is another useful method, as it credits multiple touchpoints in the customer journey, ensuring you don’t overlook any key interactions [2].
Integrating social media management tools with your CRM is a game-changer. Platforms like Oktopost, HubSpot, or Sprout Social can connect with Salesforce, enabling you to track the journey from a LinkedIn post to a signed contract [2][5]. This setup lets you identify which posts influence MQLs and monitor how quickly leads progress through your pipeline. Additionally, LinkedIn analytics can help verify if your content is reaching the right audience - specific job titles, seniority levels, and industries [2].
To stay on top of performance, establish a review schedule:
For Share of Voice, use social listening tools with Boolean operators to track both tagged and untagged brand mentions. This helps you measure how your brand compares to competitors [2]. Also, keep an eye on dark social - direct website traffic that often indicates links shared privately via email or messaging apps after someone views your content [1].
Tracking metrics is just the beginning; the real work lies in constant review and optimization. Experiment with A/B testing to determine which content formats drive the best results. For example, compare the performance of video case studies versus whitepapers. Measure actions like saves, link clicks, or form completions to see what resonates most with your audience [10].
Focus on metrics that matter. Instead of vanity numbers like impressions or likes, prioritize pipeline velocity and lead quality. These metrics reveal how quickly social-originated leads move through the funnel and the average deal size influenced by social interactions [2].
Here’s a real-world example: In November 2025, Thrive Internet Marketing Agency helped an organic supplier shift its focus from vanity metrics to high-value targeting and deeper data attribution. The result? A 188% increase in paid traffic, a 279% jump in conversions, and a 10.41X Return on Ad Spend (ROAS) [10].
Regularly review your audience targeting. Use LinkedIn’s visitor analytics to ensure your content reaches decision-makers. Pay attention to video completion rates - if viewers drop off early, it’s a sign your hook works, but the content itself might need improvement [1]. Social listening can also provide insights into how your brand is perceived compared to competitors in financial services [9][10]. Considering only 37% of marketers feel confident in their social media metrics, a disciplined review process can give your team a major edge [1].
LinkedIn stands out as the go-to platform for financial B2B firms. With over 80% of B2B social media leads originating there, it’s a natural fit for targeting decision-makers like CFOs, risk managers, and procurement leaders [2]. While engagement rates on LinkedIn might not seem high, the interactions are incredibly meaningful, often carrying more weight than similar actions on consumer-focused platforms [11].
What sets LinkedIn apart is its precision. Companies can target audiences by industry, seniority, and job title, ensuring their content reaches the right professionals. For example, LinkedIn's Visitor Analytics provides demographic insights, proving that 200 views from qualified contacts are far more impactful than 10,000 generic impressions [2].
Another major advantage? LinkedIn integrates seamlessly with CRMs like Salesforce and HubSpot. This allows firms to track the full journey - from a LinkedIn post to a signed contract - making it easier to tie social media efforts to measurable revenue outcomes [2]. The numbers speak for themselves: inbound pipeline leads from LinkedIn close at a rate of 14.6%, compared to just 1.7% for cold outbound leads [13]. Additionally, sales professionals with high Social Selling Index (SSI) scores generate 45% more opportunities and are 51% more likely to meet their quotas [14].
When measuring LinkedIn performance, prioritize quality over quantity. Metrics like connection acceptance rates, whitepaper downloads, and repeat profile visits are key indicators of early buying intent, especially in the long sales cycles typical of financial services [13]. Regularly reviewing Visitor Analytics can also help ensure your content is resonating with the right buyer personas and reveal any gaps compared to LinkedIn's industry benchmarks [2].
Now, let’s look at how KPIs should be adjusted for other platforms.
While LinkedIn is essential, other platforms bring their own strengths to the table. The trick is tailoring KPIs to match each platform’s unique advantages. For instance, Twitter (X) thrives on real-time interactions, making reply rates and sentiment tracking particularly useful during market shifts or crisis situations [12].
On platforms like Instagram and TikTok, focus on metrics such as view completion rates and save rates, which signal how much value your content is delivering [17, 19]. Meanwhile, Facebook - though less professional - can be effective for tracking group engagement and event responses, rather than directly driving sales pipeline activity [12].
Content format also plays a big role in success across platforms. On LinkedIn, multi-image posts achieve the highest engagement (around 6.60%), closely followed by native documents at 5.85% [11]. Short-form videos, however, tend to perform well universally, generating about 5.91% engagement, significantly outperforming static images, which average just 0.7% [3]. Neal Schaffer sums it up perfectly:
"Focus on engagement quality rather than quantity" [11].
As with LinkedIn, the KPIs for these platforms should align with your broader revenue and engagement objectives.
| Platform | Average Engagement Rate | Primary KPI Focus |
|---|---|---|
| 0.15% - 4% | Lead quality, connection rate, pipeline attribution | |
| TikTok | 2.7% - 3.04% | View completion, save rate |
| 0.62% - 0.64% | Save rate, share to stories | |
| Twitter (X) | 0.05% | Reply rate, sentiment tracking |
| 0.12% | Group engagement, event response |
This guide has shown how focusing on the right KPIs can directly impact revenue. Social media KPIs are essential for linking your efforts to measurable business goals. For financial B2B firms, proving ROI from social media is critical to securing budgets. Without demonstrating a connection between social media activity and revenue or pipeline influence, leadership may dismiss your efforts as background noise rather than a valuable business driver [15].
Success hinges on alignment. As Sprinklr explains:
"What a CMO calls momentum, a CEO may call noise. That is why social media KPIs exist. They are designed to transform social performance into a consistent language that the business trusts." [15]
This highlights the importance of KPIs that clearly show how social activity contributes to revenue.
Work with stakeholders to develop KPIs that align with quarterly goals. Use the SMART framework and map your customer journey to ensure the chosen metrics match each stage - from building awareness to retaining customers [1][4]. Well-defined KPIs can turn your plans into measurable outcomes.
While engagement signals interest, it’s the actions people take after interacting that truly matter [2]. To capture the full impact of social media, integrate its data with CRM tools like Salesforce or HubSpot. Regular monthly reviews can help you identify trends, while quarterly assessments ensure your strategy stays aligned with broader goals [5].
Shifting focus from vanity metrics to meaningful KPIs - like pipeline velocity and customer lifetime value - can transform social media into a reliable revenue generator. The firms that succeed are those that measure what truly matters, not just what’s easy to track [2].
When setting your KPIs, it’s essential to align them with your revenue goals and overall strategy. Instead of getting distracted by vanity metrics like followers or likes, prioritize metrics that directly impact your bottom line. For example, focus on lead conversion rates, engagement that drives sales, and revenue contribution.
A great way to identify high-value prospects is by applying the 95:5 rule, which helps you target the small percentage of your audience most likely to convert. And don’t forget, KPIs aren’t set in stone. Regularly review them to ensure they stay aligned with your business priorities and reflect your progress toward hitting revenue targets.
To show how social media contributes to your sales pipeline and closed deals, it's crucial to use attribution methods that connect social activities directly to business outcomes. Multi-touch attribution models are particularly useful here, as they can trace how social media impacts buyer journeys that often take months to unfold.
Take advantage of AI-powered analytics to assess lead quality, track engagement, and measure conversions. Keep an eye on key metrics like interactions with decision-makers and the progression of leads through your funnel. This approach helps you clearly illustrate how social media plays a role in generating revenue and closing deals.
To monitor long sales cycles stemming from social media interactions, prioritize pipeline attribution. This method ties your social media activities directly to pipeline growth and revenue. Key metrics to focus on include pipeline influence, lead quality, conversion rates, and velocity. Using advanced analytics and AI tools can make tracking more effective by linking social media engagement to actual sales results. This approach allows B2B companies to refine their strategies, ensuring consistent engagement and revenue progress.
%20(5).png)
