%20Bold.png)
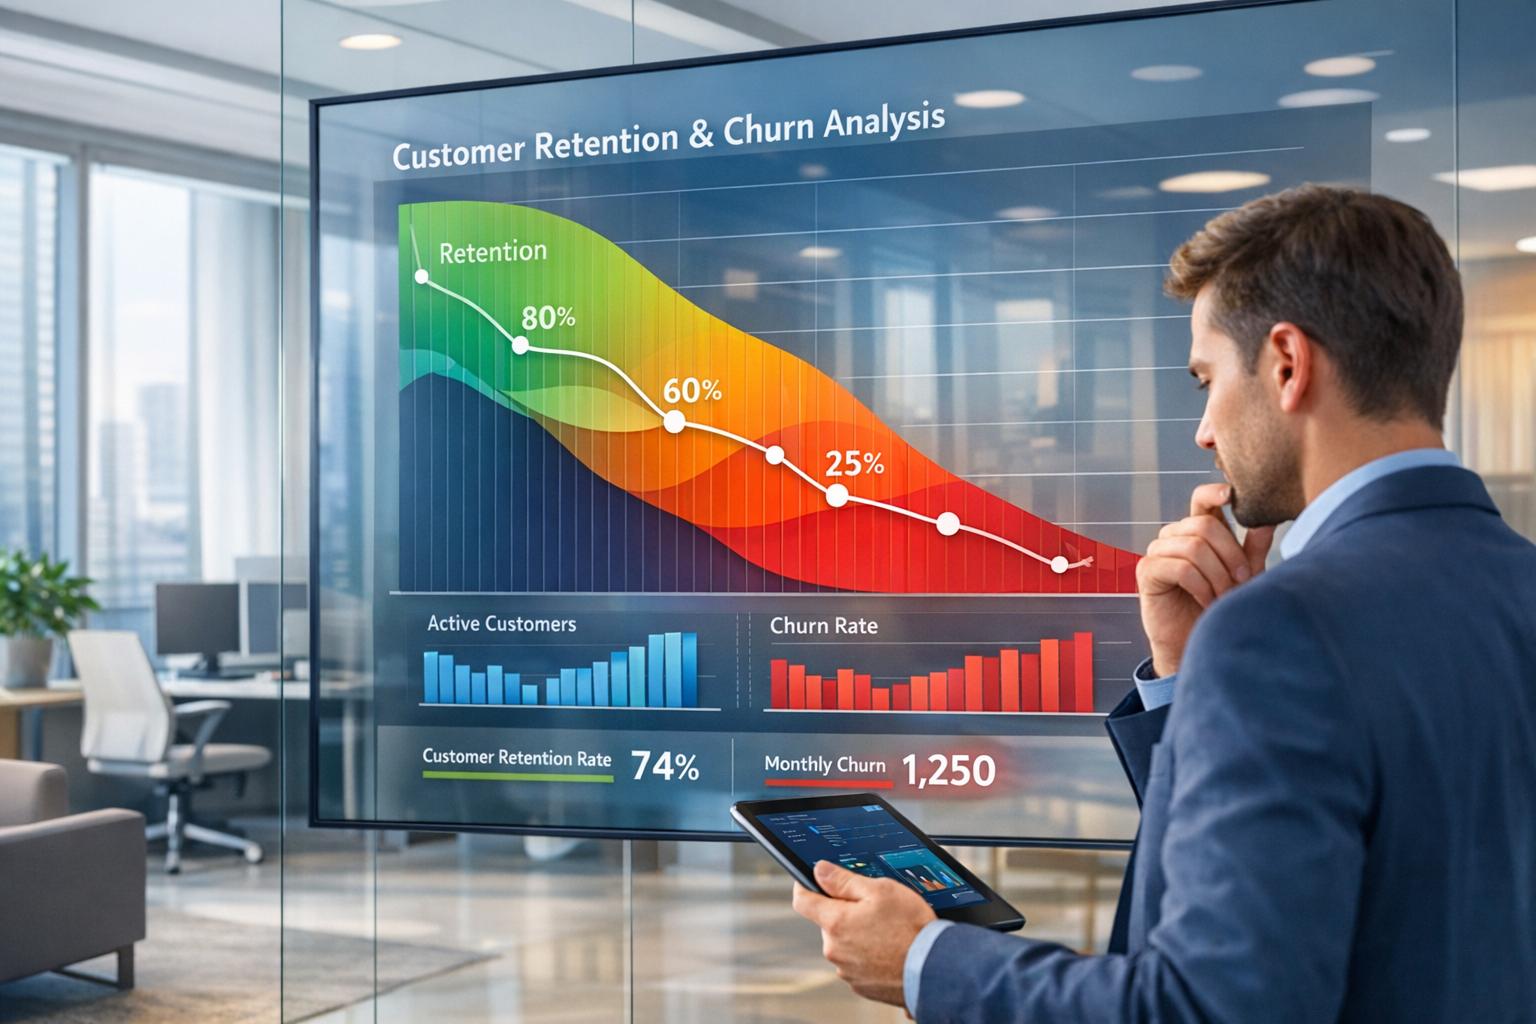
Customer churn costs financial institutions billions annually, with churn rates in banking reaching up to 25%. Retaining customers is far cheaper than acquiring new ones, and even a 5% increase in retention can drive profits by 25–95%. The challenge? Churn in financial services often happens subtly - through reduced activity or quiet shifts to competitors - making it harder to detect.
Here’s how to tackle churn effectively:
Reducing churn isn’t just about saving money - it’s about understanding your customers and strengthening relationships. By combining clear metrics, robust data, and targeted interventions, financial institutions can manage churn and drive sustainable growth.
Churn, often referred to as customer attrition, occurs when a client stops using your institution's products or services. In banking, this could mean account closures, maintaining a zero balance, or complete inactivity.
Financial institutions generally face two types of churn. "Hard churn" happens when accounts are closed within a short time frame, such as days or weeks. On the other hand, "soft" or "silent churn" is more subtle and gradual. In these cases, customers reduce their activity over months or even years. For example, they may keep an account open but shift their primary banking activities elsewhere, turning the account into a secondary option.
In the mortgage industry, churn takes on a slightly different meaning. It often refers to customers refinancing their loans with another lender or paying off their loan early. This is a significant challenge for lenders, especially since over 60% of mortgage applications involve refinancing existing loans.
Measuring churn is crucial because it provides insights into the health of your institution. Even a small improvement can make a big difference - reducing churn by just 5% can boost profits by 25% to 125%. Beyond financial implications, churned customers may leave with negative impressions, potentially damaging your reputation through poor reviews or word-of-mouth. As Mozhdeh Rastegar-Panah, Senior Director of Product Marketing at Zendesk, explains:
"Churn impacts nearly every aspect of a company, from the product and revenue to customer satisfaction and loyalty."
To fully grasp churn’s impact, it’s essential to track specific performance metrics.
Once churn is defined, the next step is to measure its effects. Here are some key metrics financial institutions should monitor:
Additionally, engagement metrics like transaction volume, login frequency, and service usage can provide early warnings of silent churn. For instance, a drop in deposit balances or the absence of inflow transactions might indicate that customers are moving their funds to another bank. According to Acuity Knowledge Partners:
"A decline in the deposit balance, along with the absence of inflow transactions, is a signal that funds are being diverted to other banks."
It’s also important to distinguish between voluntary churn and involuntary churn. Voluntary churn happens when customers actively decide to leave, often due to dissatisfaction with pricing, services, or products. In contrast, involuntary churn occurs for reasons like failed payments or expired credit cards. On average, B2B subscription services experience about 3.5% churn, with 2.6% being voluntary and 0.8% involuntary. While involuntary churn can often be resolved with automated systems, voluntary churn usually requires deeper changes to meet customer needs.
The foundation of effective churn analysis lies in thorough data collection and preparation. Financial institutions rely heavily on internal systems to gather critical information. CRMs provide customer demographics, core banking platforms track account balances and tenure, ERPs handle billing and revenue data, and support platforms log chat histories and call frequencies. Together, these systems paint a picture of how customers interact with and use your services.
But internal data alone doesn’t tell the whole story. To gain a broader perspective, institutions turn to external sources like credit bureaus, web search activity (e.g., customers searching for "loan refinancing"), and social media sentiment analysis. These external insights help uncover market trends and competitive pressures that might influence customer behavior. As Acuity Knowledge Partners emphasizes:
"Data transformation to make the underlying datasets ready for analysis is essential to facilitate fast and accurate data analytics".
Building a comprehensive Customer 360 view is key. This involves combining data from various touchpoints - product holdings, clickstreams, marketing interactions, and support history - into a unified record. Financial institutions often extract data from legacy systems, mainframes, and local databases, consolidating it into centralized hubs like Data Lakes or Data Warehouses. Taking monthly snapshots (e.g., on the 20th of each month) provides a dynamic view of customer behavior over time, rather than a static snapshot of the present.
Once the data is gathered, cleaning it is the next essential step. This involves eliminating duplicates, addressing missing values (either by imputing or removing them), and standardizing formats to ensure consistency. For example, categorical variables like "product type" may need to be converted into numerical formats, and values should be normalized to enable machine learning models to process them effectively.
Organizing data into time-stamped snapshots is crucial for predictive accuracy. These snapshots capture customer metrics at specific intervals, particularly leading up to renewal dates, ensuring the model forecasts future behavior instead of reacting to past events. Additionally, it’s important to distinguish between involuntary churn (e.g., payment failures or expired cards) and voluntary churn (e.g., active cancellations) during the cleaning process. Stripe highlights the importance of ethical practices:
"Comply with all legal and ethical guidelines in data collection, storage, and analysis, especially regarding customer privacy and data security".
This means implementing robust anonymization techniques and enforcing strict access controls to protect customer data throughout the preparation process. A well-structured and time-based approach to data ensures that predictive churn models are both accurate and actionable.
| Data Category | Specific Data Points | Source |
|---|---|---|
| Demographics | Age, location, gender, tenure, company size | CRM / Onboarding Forms |
| Transactional | Deposit activity, loan payments, fee changes | Core Banking / Billing Systems |
| Engagement | Login frequency, clickstreams, app usage | Digital Interaction Logs |
| Support | Chat counts, complaint types, satisfaction scores | Customer Support Systems |
| External | Credit scores, competitor interest, market trends | Credit Bureaus / Web Analytics |
With clean and structured data in place, the stage is set to deploy advanced analytics and uncover actionable churn patterns.
Churn Prediction Models Comparison for Financial Services
Descriptive analysis looks at historical data to understand when and why customers leave. In financial services, it’s important to differentiate between hard churn, like account closures within a short period, and soft churn, where customers gradually decrease deposits or transaction activity.
A good starting point is cohort analysis. This involves grouping customers based on shared traits - like when they joined, the products they use, or their location - and tracking how churn varies across these groups. For instance, customers who opened accounts in Q1 2024 may show different retention trends compared to those from Q3 2024. This can help pinpoint whether certain acquisition channels or onboarding processes lead to higher churn rates, providing a foundation for more targeted strategies.
Another method is time series analysis, which examines churn trends over time, such as monthly or quarterly. This approach can uncover seasonal patterns or highlight the effects of market events. For example, did churn increase after a fee hike in June 2024? Or did refinancing activity rise when interest rates dropped in September 2024? These insights can inform key decisions.
To add more depth, sentiment analysis can be applied to customer feedback and support tickets using natural language processing (NLP). If recurring complaints like "high fees" or "poor mobile app experience" are tied to churn, these pain points become actionable. Additionally, dividing metrics like monthly revenue or transaction frequency into 10 equal-sized buckets can help visualize how specific behaviors correlate with churn rates.
Once historical trends are clear, predictive models help forecast future churn. These models assign a churn risk score to individual customers, allowing businesses to intervene before customers leave. Clean, time-stamped data is crucial for building accurate models. Start by engineering features that signal early churn risk, such as declining deposits, reduced wallet share, or searches linked to competitors.
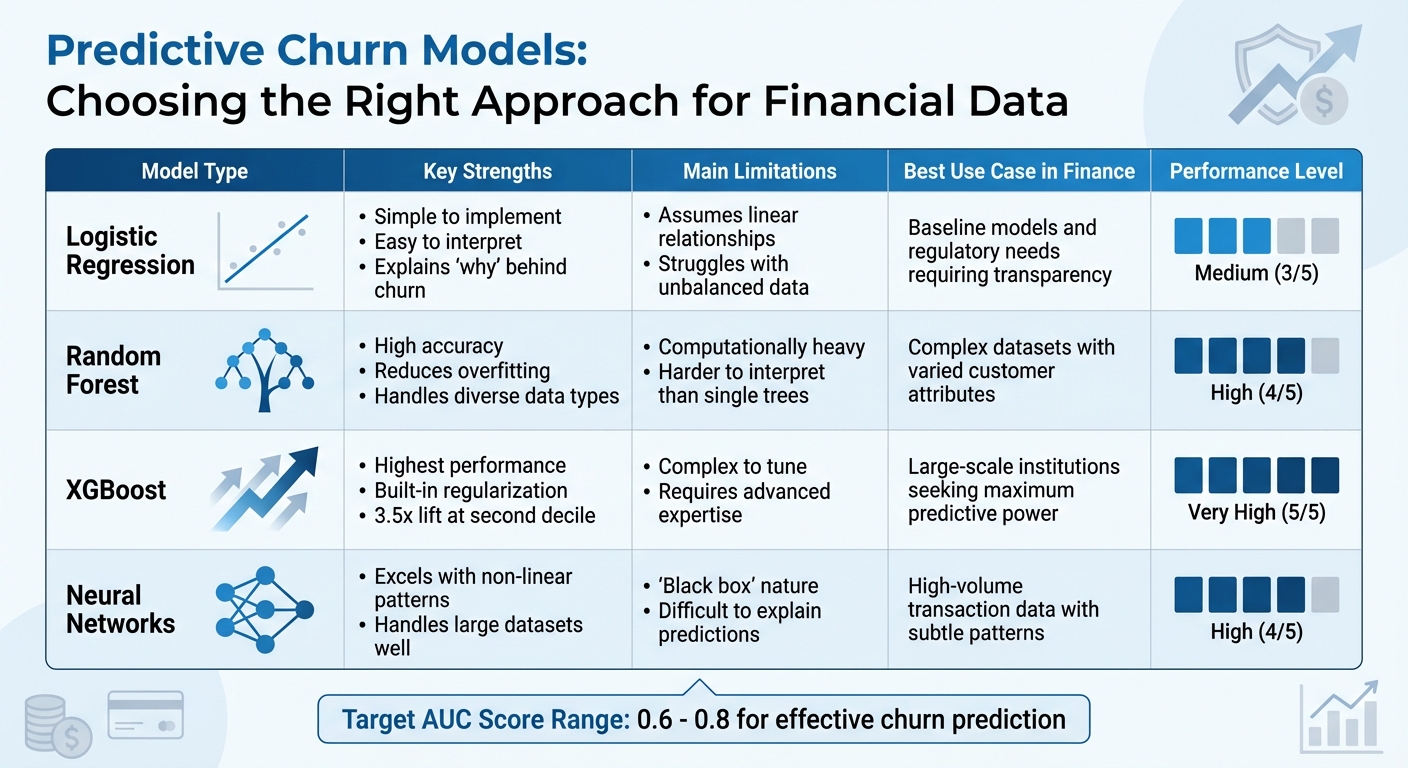
Logistic regression is a straightforward option. It provides clear probability scores and is easy to interpret. However, it assumes linear relationships and struggles with datasets where churners are a small fraction of the total (often just 10-15%).
For more complex datasets, random forests are a better choice. They combine predictions from multiple decision trees, reducing overfitting and capturing non-linear relationships. For example, JPMorgan Chase saw a 40% boost in retention by using churn analysis tools that monitored transaction frequency, dormant accounts, and digital engagement.
At the cutting edge is XGBoost, which excels in handling large, high-dimensional datasets. It uses gradient boosting to correct errors iteratively, delivering strong performance. In mortgage businesses, XGBoost-powered models can achieve a 3.5x lift at the second decile, identifying about 70% of churners. However, tuning these models requires advanced expertise.
When training models, use time series splits rather than random cross-validation to ensure the model learns from past data and avoids "data leakage", where future information skews the training data. To address data imbalance, techniques like SMOTE (Synthetic Minority Oversampling Technique) can help prevent the model from defaulting to predictions that most customers will stay.
A well-performing churn prediction model typically achieves an AUC (Area Under the Curve) score between 0.6 and 0.8. But as Stripe aptly puts it:
"Predicting churn is only the first step - using that information effectively to retain customers is what counts".
Here’s a quick breakdown of the strengths and limitations of different predictive models for financial datasets:
| Model Type | Strengths | Limitations | Suitability for Financial Data |
|---|---|---|---|
| Logistic Regression | Simple to implement; easy to interpret; explains "why" behind churn | Assumes linear relationships; struggles with unbalanced data | Ideal for baseline models and regulatory needs requiring transparency |
| Decision Trees | Intuitive and visual; works well with numerical and categorical data | Prone to overfitting, capturing data "noise" | Useful for identifying decision paths in retail banking |
| Random Forest | High accuracy; reduces overfitting; handles diverse data | Computationally heavy; harder to interpret than single trees | Great for complex datasets with varied customer attributes |
| XGBoost | High performance; includes regularization to avoid overfitting | Complex to tune; requires expertise | Best for large-scale institutions seeking strong predictive power |
| Neural Networks | Excels with non-linear patterns in large datasets | "Black box" makes it hard to explain predictions | Suitable for high-volume transaction data with subtle patterns |
To effectively manage retention, start by assigning churn probabilities (ranging from 0 to 1) using propensity scoring. This allows you to group customers into risk tiers: High Risk (greater than 0.75), Moderate Risk (0.5–0.75), and Low Risk (0.25–0.5).
Take this a step further with a 3x3 value-risk matrix. By combining churn probability with customer lifetime value (CLV), you can identify and prioritize "High Value, High Risk" customers for personalized retention efforts. On the other hand, low-value customers with high churn risk might only warrant automated email campaigns.
To make these segments even more precise, analyze key behavioral indicators. For example, segmenting by life stage can reveal important differences: younger customers often prioritize affordability, while families might value convenience. These insights allow you to fine-tune your messaging and offers to resonate with the specific needs of each group.
This kind of segmentation lays the groundwork for highly targeted retention strategies.
Once you've segmented your customers, the next step is aligning retention strategies with the urgency and value of each group. For high-risk customers, consider setting real-time alerts - for instance, when churn likelihood hits 80%. These alerts can trigger immediate actions like personalized outreach or tailored pricing adjustments.
For customers in the moderate-risk category, automated re-engagement campaigns can help maintain their loyalty. Low-risk customers, while requiring less attention, still benefit from passive efforts like loyalty program updates and occasional monitoring.
When rolling out retention initiatives, always include control groups to measure effectiveness. A great example comes from a retail bank in Indonesia. In July 2021, the bank used multivariate testing across customer segments to revamp its savings and loan products. The results? A 50% boost in operating profit and a fivefold (500%) increase in personal loan uptake. Without control groups, you risk wasting resources on customers who would have stayed loyal anyway.
As Bain & Company notes:
"Indiscriminate retention hurts a bank's economics, because it entails spending money on loss-making customers or focusing on customers not susceptible to intervention."
It's also crucial to monitor silent churn, which can show up as reduced wallet share or declining transaction volumes. For involuntary churn - like failed payments or expired cards - automated dunning management can recover customers before they even realize there's an issue.
Visual tools make it easier to prioritize retention efforts and communicate strategies across teams. For example, the table below highlights customer risk profiles, churn signals, and recommended actions:
| Segment Risk Profile | Churn Indicators | Recommended Retention Strategy |
|---|---|---|
| High Risk | Low transaction frequency, declining balances, high support tickets | Strong: Personalized outreach, fee waivers, or direct relationship manager involvement |
| Moderate Risk | Static engagement, upcoming contract renewal, mid-tier balances | Moderate: Loyalty program offers, product tutorials, or "check-in" emails |
| Low Risk | High engagement, consistent balances, multi-product usage | Weak/Passive: Automated newsletters, community engagement, cross-selling new features |
Beyond tables, feature importance bar charts from machine learning models like Random Forest or XGBoost can help identify the strongest predictors of churn, such as declining deposit balances or reduced support chat frequency. These visualizations give frontline staff a clear understanding of why a customer is at risk and what actions to take.
Some organizations also leverage social network analysis to map customer relationships. Customers with fewer or weaker institutional ties often have higher churn rates - 1.1% compared to 0.6% for those with stronger connections. By mapping these networks, you can pinpoint which customers are most vulnerable and which are anchored by multiple relationships with your business.
Start by defining churn in clear terms, such as account closures, zero balances, or refinancing cases. Then, bring together data from various sources - CRM systems, transaction logs, and customer support interactions - into a single, unified view. This consolidated data forms the backbone for identifying early-warning signs, like declining deposit balances or sudden drops in transaction activity.
Once your data is organized, use it to build predictive models, such as XGBoost or Random Forest, to calculate churn risk scores. These scores typically achieve an AUC range of 0.6–0.8. Segment customers by their risk level and overall value to prioritize retention efforts where they matter most.
With churn risk scores in hand, set up closed-loop systems that generate alerts when a customer's churn risk surpasses 80%. Establish strict response KPIs - like resolving high-risk cases within 24 hours - to ensure timely action. Before rolling out retention strategies on a large scale, test them against control groups to accurately measure their effectiveness.
As Gabriele Albini, a data scientist, puts it:
"Predicting churn is merely the starting point to design an effective customer retention strategy".
Use these insights to refine your offerings, adjust fee structures, and conduct exit interviews to uncover potential issues with pricing or service.
It's often best to begin with a single product line, allowing you to fine-tune your data collection and modeling processes. Early implementation not only helps reduce churn but also strengthens relationships with your most valuable customers.
Hard churn happens when a customer takes the definitive step of closing an account or canceling a service, signaling the end of their relationship with the financial institution. On the other hand, soft churn is more subtle - it shows up as a gradual drop in engagement, like fewer transactions, reduced logins, downgraded services, or lower revenue per account, even though the account remains technically active.
To combat these challenges, financial institutions can take the following steps:
By analyzing these behaviors, institutions can categorize customers and implement targeted strategies. For soft churn, engagement campaigns or personalized offers can help re-engage users. For hard churn, win-back initiatives or exit interviews can provide insights into why customers are leaving. Tools like AI-driven platforms can make this process smoother by automating customer segmentation, improving predictive models, and enabling timely retention efforts to keep churn under control.
Cleaning and organizing customer data is a crucial step in performing accurate churn analysis. Start by pulling together data from all sources - like banking systems, CRM platforms, and third-party feeds - into one unified dataset. Make sure each customer has a single, unique record that includes essential details such as identifiers, transaction history, and demographic information. Eliminate duplicate records, fix inconsistencies (e.g., standardizing "checking" vs. "Checking"), and ensure uniform formatting for elements like dates (MM/DD/YYYY), currency (e.g., $123.45), and numbers (e.g., 1,000 for thousands).
Handle missing or unusual data values with care. For critical fields such as account balances or product usage, consider methods like median imputation or model-based estimates to fill gaps, and clearly flag these adjustments for transparency. Examine outliers closely - large transactions might be valid or could indicate errors - and use techniques like capping to prevent them from distorting your analysis. Standardize numeric fields to keep the data consistent and create meaningful features, such as calculating "days since last login" or tracking "monthly balance changes."
Don’t overlook data privacy and governance. Protect sensitive information by masking personal details, limit access to authorized personnel, and maintain detailed audit trails. Automating these processes not only saves time but also ensures greater accuracy. Tools like Visora can assist financial services leaders in implementing AI-powered workflows that simplify data preparation and enable faster, more actionable churn insights.
Predictive models, such as XGBoost, leverage historical customer data - like transaction records, product usage patterns, and demographic information - to uncover trends that signal a risk of churn. These models generate a churn risk score for each customer, enabling financial institutions to pinpoint accounts that may need immediate attention.
Armed with this information, businesses can roll out timely, personalized retention efforts. Whether it’s crafting tailored offers or enhancing customer support, these strategies address individual customer concerns directly. This approach not only helps reduce churn but also ensures resources are used wisely, boosting customer satisfaction and fostering loyalty.
%20(5).png)
