%20Bold.png)
Email marketing remains the most effective channel for B2B companies, offering a $36–$42 return for every $1 spent. But success in 2026 requires moving beyond outdated metrics like open rates. Instead, focus on engagement signals that drive revenue, such as click-through rates (CTR), reply rates, and conversion rates.
Key highlights:
2026 Trends:
This guide outlines practical steps to improve email performance, including segmentation, AI-powered personalization, and tracking advanced metrics to boost revenue and shorten deal cycles.

B2B Email Engagement Metrics Benchmarks and Critical Thresholds 2026
When it comes to evaluating email performance, understanding the right metrics can make all the difference. These metrics give B2B teams the insights they need to fine-tune strategies and focus on what drives real results. Below, we’ll break down the essential metrics that form the backbone of any effective B2B email campaign.
The open rate represents the percentage of recipients who opened your email out of the total delivered. This metric primarily reflects how compelling your subject line, sender name, and preheader text are. In 2025, the median B2B open rate was between 36.7% and 42.35% [1].
However, open rates have become less reliable due to factors like Apple’s Mail Privacy Protection (MPP) and Gmail’s proxy opens, which inflate numbers by 10% to 15% [1]. These "ghost opens" occur when emails are marked as opened even if they weren’t actually viewed.
"Open rate? It's now primarily a diagnostic tool for email deliverability and sender reputation issues." - Mary Jalilibaleh, Marketing Manager, Cufinder [9]
A sudden drop of 15% or more could signal deliverability problems, such as emails being flagged as spam or domain issues [9]. While open rates can still highlight potential technical problems, they’re no longer a reliable measure of recipient interest.
For a clearer picture of engagement, CTR is the next step.
The click-through rate (CTR) measures the percentage of recipients who clicked a link in your email out of the total delivered. With average B2B CTRs falling between 2.0% and 4.0% [1], this metric is a stronger indicator of how well your content resonates with your audience.
CTR answers a key question: Did your content and call-to-action (CTA) spark interest? If your CTR is below 1%, it could mean your targeting is off or your messaging isn’t hitting the mark [1]. On the other hand, campaigns leveraging AI-driven personalization have shown impressive results, achieving an average CTR of 13.44%, compared to just 3% for non-AI campaigns [1].
For even deeper insights, CTOR helps isolate content performance.
The click-to-open rate (CTOR) measures the percentage of unique openers who clicked a link, offering a more focused view of content effectiveness. Typical B2B CTOR ranges are between 5.63% and 7.4% [1, 13].
This metric tells you how well your email content connects with those who opened it. A low CTR but a high CTOR suggests your content is working, but your subject line or audience targeting might need improvement. If both are low, it’s time to reevaluate your messaging strategy [5]. A CTOR below 3% could indicate issues with the email body, placement of your CTA, or the value of your offer [1].
While these metrics highlight engagement, the conversion rate focuses on tangible results.
The conversion rate tracks the percentage of recipients who completed a specific goal, such as scheduling a meeting, downloading a resource, or making a purchase. For B2B emails, the average conversion rate is around 2.5% [1].
Conversions are where interest turns into action, making this metric critical for assessing revenue impact. Cold outreach campaigns typically see conversion rates between 0.2% and 1%, while emails targeting decision-stage prospects can achieve rates of 10% to 20% [1]. If your conversion rate is below 0.5%, it might point to issues like poorly aligned offers, friction on landing pages, or mismatched targeting [1].
For a complete view of campaign performance, it’s also important to monitor unsubscribe and forward rates.
The unsubscribe rate measures the percentage of recipients who opt out after receiving your email. For B2B campaigns, a healthy unsubscribe rate falls between 0.08% and 0.1% [1]. If it climbs above 0.5%, it could indicate over-sending, poor targeting, or content that fails to engage. Using preference centers to let recipients adjust email frequency can reduce unsubscribes by 20% to 40% [1].
The forward rate, on the other hand, shows how often recipients share your email with others. A high forward rate signals that your content is resonating and has the potential to reach new decision-makers outside your current list [2].
| Metric | B2B Average | Critical Threshold | What It Reveals |
|---|---|---|---|
| Open Rate | 36.7%–42.35% | <20% | Subject line effectiveness / Deliverability |
| CTR | 2.0%–4.0% | <1% | Audience interest and intent |
| CTOR | 5.63%–7.4% | <3% | Content relevance among openers |
| Conversion Rate | 2.5% | <0.5% | Revenue impact and funnel performance |
| Unsubscribe Rate | 0.08%–0.1% | >0.5% | Content relevance and email frequency |
When it comes to B2B email performance, the numbers can differ significantly across industries. While there are general averages for key metrics, diving into industry-specific data helps create more targeted and effective email strategies. Below are some insights into how different industries stack up in terms of open rates, click-through rates (CTR), and conversion rates.
Consulting and Professional Services
This industry sees open rates ranging from 28.9% to 45.9%, CTRs between 2.4% and 4.5%, and conversion rates averaging 3.5% [11][10]. Because consulting thrives on building relationships, emails with personalized and professionally relevant content tend to perform better.
SaaS and Software
For SaaS companies, open rates fall between 28% and 39.3% [11][12], with CTRs ranging from 1.15% to 5.0% [11][12]. Conversion rates average around 2.1%, though they can vary between 1.5% and 3.5% [10][12]. Given the tech-savvy audience in this sector, data-driven and highly tailored messaging works best, as generic outreach is less effective.
Finance and Insurance
Campaigns in this sector report open rates between 24% and 43.3% [12], CTRs from 2.5% to 4.0% [12], and conversion rates averaging 2.4% [10]. Email authentication protocols like SPF, DKIM, and DMARC are critical here, as stricter spam filters can hinder deliverability.
Real Estate
Cold outreach emails in real estate can achieve open rates as high as 39.2% [13], though the overall average is closer to 19.9% [14]. CTRs typically range between 1.5% and 3.6% [14]. In this relationship-driven field, personalized and locally relevant messaging often outperforms generic updates.
| Industry | Avg. Open Rate | Avg. Click Rate (CTR) | Avg. Conversion Rate |
|---|---|---|---|
| Consulting | 28.9%–45.9% [11] | 2.4%–4.5% [11] | 3.5% [10] |
| SaaS | 28%–39.3% [11][12] | 1.15%–5.0% [11][12] | 1.5%–3.5% [10][12] |
| Finance | 24%–43.3% [12] | 2.5%–4.0% [12] | 2.0%–4.0% [12] |
| Real Estate | 19.9%–39.2% [14][13] | 1.5%–3.6% [14] | 0.8%–2.5% |
While these benchmarks provide a useful reference, the quality of your email list makes all the difference. A smaller, highly engaged list will always outperform a larger, less interested audience.
Core metrics are a great starting point, but advanced metrics dig deeper into reader intent and financial results. With Apple Mail Privacy Protection impacting 48% to 53.67% of email opens globally by 2026, the focus is shifting. Instead of relying on passive engagement, marketers are turning to metrics that reflect active responses [19].
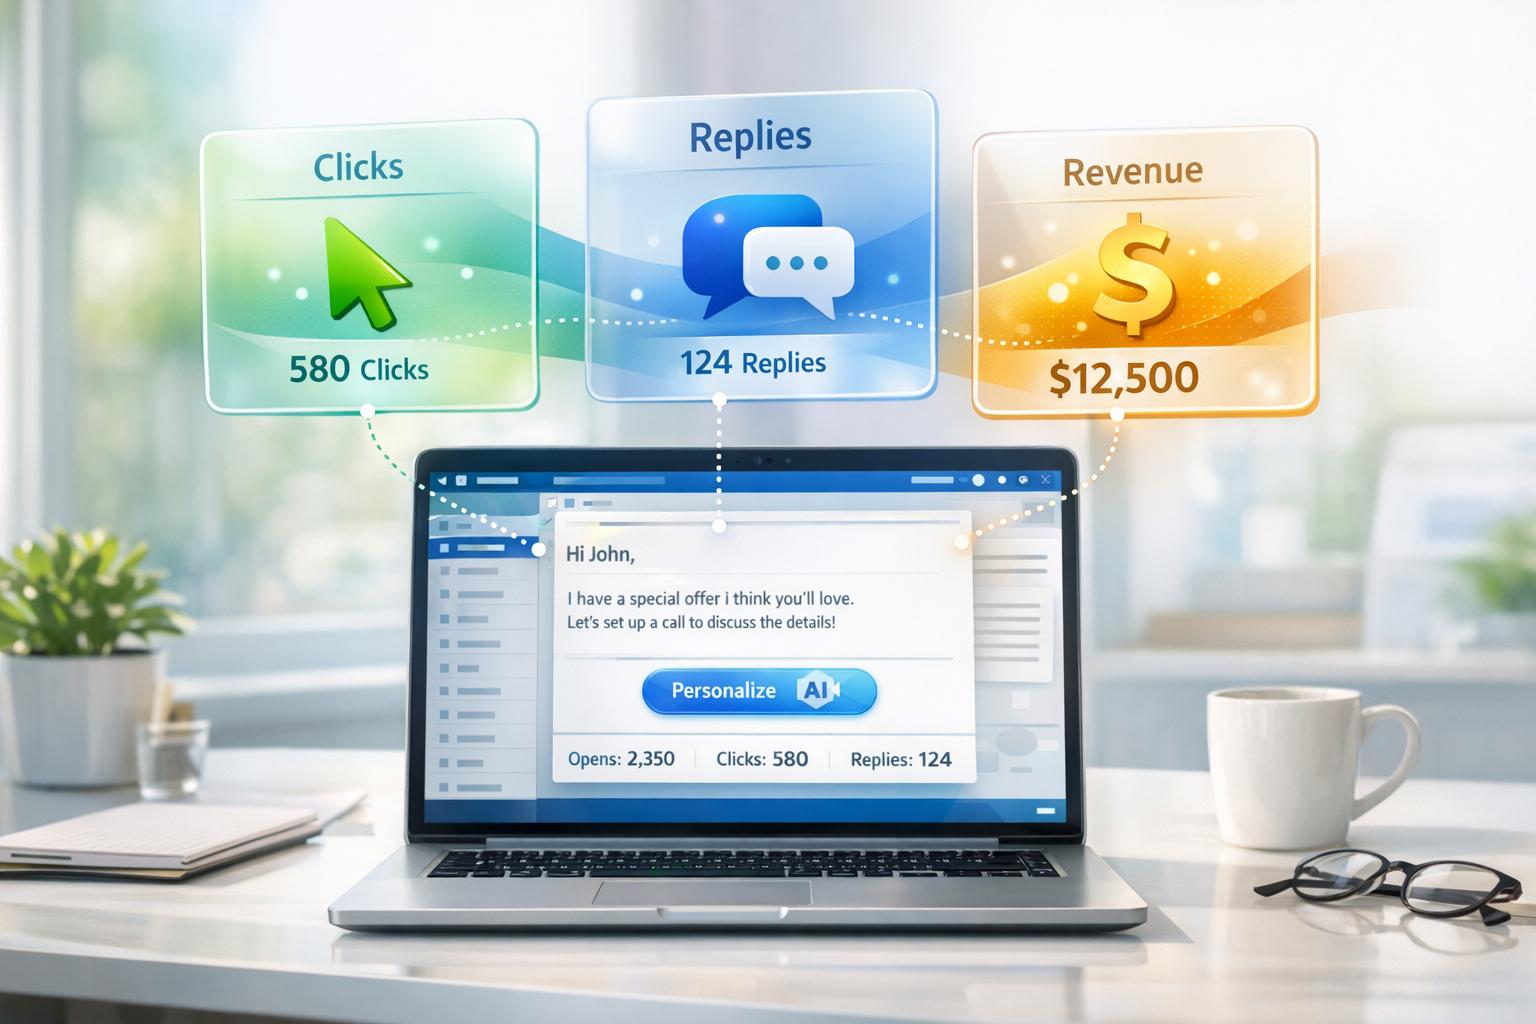
Replies are one of the clearest signs of genuine engagement - far more meaningful than clicks, which often show curiosity rather than commitment. For B2B campaigns, reply rates generally range from 5% to 15%, with hyper-personalized efforts sometimes surpassing 20% [4][19]. But not all replies are created equal. Using AI-powered sentiment analysis, marketers can categorize responses into buckets like "Interested", "Meeting Booked", or "Out of Office", helping filter out irrelevant replies [19].
"Reply rate is often called the holy grail of email marketing KPIs... a reply indicates true engagement." - Mailgo [4]
However, inbox fatigue is real. Cold outreach reply rates dropped from 6.8% in 2023 to 5.8% in 2025 [1]. To get meaningful data, it's essential to filter out auto-responders and analyze reply latency - the time it takes for someone to respond. Shorter response times often indicate higher urgency or interest [19].
Metrics like read time and scroll depth offer insight into how well your content holds attention. For promotional emails, a read time of 30–60 seconds is solid, while newsletters or educational materials should aim for 60–90+ seconds [18]. Scroll depth, on the other hand, shows how far recipients progress through your email. A healthy campaign sees 50%+ of openers scrolling past the halfway point and 30%+ reaching the bottom [18].
These insights can help you fine-tune your email strategy. For example, if most readers drop off around 40% scroll depth, consider moving your key call-to-action higher or breaking up dense text with visuals [18]. Tracking engagement velocity - the rate at which attention wanes over time - can also help identify list fatigue before it starts affecting deliverability [16].
Revenue per Email (RPE) connects your email campaigns directly to revenue. It’s calculated by dividing the total revenue generated by the number of emails sent [7][17]. Unlike clicks, which show interest, RPE highlights financial impact. To track it effectively, integrate your email tool with your CRM, use UTM parameters, and tag leads based on which email step triggered the reply [19].
"The best way to optimize email revenue per recipient is by refining your segmentation strategy." - Randy McHugh, Founder, Stimulate Agency [17]
Go beyond the initial click by monitoring post-click actions like time spent on landing pages, items added to cart, or meetings scheduled [17]. Some teams even assign weighted scores (e.g., 1 for an open, 5 for a click, 15 for a reply) to identify their most valuable contacts [18]. This allows for a more precise evaluation of your campaign's performance and its contribution to overall revenue.
Tracking B2B email engagement effectively requires a well-organized setup across three key areas: ESP configuration, analytics integration, and CRM synchronization [20]. To ensure your engagement metrics are accurate, start by enabling open and click tracking in your ESP dashboard. Then, configure SPF, DKIM, and DMARC records to authenticate your sending domain. Without these, your emails could end up in spam folders, making your data unreliable [16][20].
Using branded tracking domains, like links.yourdomain.com, instead of generic ESP redirects, is another smart move. This approach builds recipient trust and avoids spam filters that might flag unfamiliar redirect URLs [20]. Also, make sure every link includes standardized UTM parameters (e.g., utm_source=email, utm_medium=newsletter, utm_campaign=q2_product_launch). These allow you to track user behavior from your email campaigns directly in Google Analytics 4 [20].
One of the challenges in 2026 is dealing with inaccuracies caused by automated interactions. For instance, Apple's Mail Privacy Protection and security scanners can create false positives by automatically loading images. Using AI tools to filter out bot activity and focus on genuine human interactions is essential [3][16][21].
"Great emails are a conversation. The only way to assess how what you are saying is perceived is by studying the reactions to your email. Whether someone clicks, shares, and/or replies are the 'facial expressions' and 'words' that a person shares back." - Seth Giammanco, Principal, Strategy and Technology, Minds On Design Lab [6]
Testing is another crucial step. Send test emails to platforms like Gmail, Outlook, and Apple Mail to ensure tracking pixels and link redirects work as intended [20]. Keep an eye on your domain reputation weekly - this serves as a good indicator of your email deliverability [16]. Additionally, clean up your email list by removing contacts who haven’t engaged within 60–90 days. This helps maintain accurate metrics and protects your deliverability rates [20][22].
In the ever-changing world of B2B email engagement, the focus has shifted from quantity to quality. The standout trend this year? Sending smarter, not more. High-performing email programs are now sending 30% fewer emails while achieving 30% higher open rates and 50% higher click-through rates by prioritizing precision over sheer volume [1]. Deliverability has also become a strategic priority, with inbox placement averaging 84.3% [15]. This focus on smarter strategies is paving the way for innovations like AI-driven personalization.
AI is proving to be a transformative force in email marketing. In 2026, 64% of marketers are using AI in their email campaigns, and the results speak for themselves - AI-powered campaigns are outperforming traditional methods in terms of engagement [15]. Today’s AI goes far beyond simple personalization, incorporating nuanced details like recent hiring trends, funding news, or specific challenges tied to a recipient’s role. This level of relevance makes emails feel more tailored and meaningful [25]. Additionally, automated email flows are becoming a revenue powerhouse, contributing 41% of email-generated revenue while accounting for just 2% of total send volume [15].
Buyer behavior is also evolving. A notable 61% of B2B buyers now prefer an experience free from traditional advertisements [23]. As a result, email content is shifting from hard sales pitches to providing insightful guidance that supports decision-making, similar to effective lead generation for real estate agents. This change is driving a move toward multi-channel strategies. By combining email with platforms like LinkedIn and phone outreach, companies are seeing significant results - those using three or more channels achieve 250% higher purchase rates compared to single-channel efforts [26]. For example, campaigns that integrate email and LinkedIn are generating 3.5 times more meetings from the same contact lists [27]. These shifts make it clear that basic engagement metrics like open rates are no longer enough; deeper insights into buyer intent are becoming essential.
"The vendor who engages a buyer first wins the deal 50-65% of the time." – Forrester [24]
A key trend to watch is the move from basic engagement metrics to intent signals. With Apple Mail Privacy Protection inflating open rates by 10-15% [1], marketers are turning their attention to more reliable indicators like clicks, replies, and interactions across multiple channels. By leveraging third-party data to identify intent signals early, teams can gain a competitive edge of 2–4 weeks [24]. Email is no longer just a broadcast tool - it’s becoming a critical way to capture buying signals that inform broader marketing and sales strategies.
Boosting email engagement in B2B settings requires a shift from sending high volumes of generic emails to crafting precise, targeted messages. By combining AI-driven personalization, smart segmentation, and well-thought-out design, you can create emails that resonate with recipients and encourage meaningful actions.
AI has evolved far beyond basic personalization like including a recipient's name. It now integrates contextual details - such as recent company updates, hiring trends, or leadership changes - to make each email feel timely and relevant. For instance, Peacock (NBCUniversal) collaborated with Braze, mParticle, and Movable Ink in 2024 to create a personalized "year-in-review" campaign. By using actual viewing data, they highlighted users' favorite genres and engagement habits, which led to a 20% drop in churn and a 6% increase in upgrades to paid subscriptions within 30 days [8].
AI tools can handle the heavy lifting of research, pulling in public data like funding announcements or technology updates to create drafts that are 70–80% complete. This allows sales teams to focus on refining the message and crafting an effective call-to-action [25]. Feeding AI tools with proven messaging strategies, common objections, and authentic customer language - gleaned from call recordings - further enhances the quality of these drafts. Personalized subject lines are 26% more likely to be opened, and AI-personalized emails have an 82% higher open rate compared to generic bulk emails [25].
"The best AI personalization doesn't replace your SDRs - it replaces the blank page, so humans can focus on judgment, accuracy, and moving conversations forward." - SalesHive [25]
To test the impact of AI personalization, try adding one contextual field (like a recent company announcement) to your existing email sequence. Then, A/B test this version against your standard template. Metrics like reply rates, meetings booked, and pipeline growth per 1,000 emails sent can help determine whether your personalization efforts are driving real results. It's also essential to limit AI tools to verified CRM data and publicly available information to avoid inaccuracies or "hallucinations" [25].
Segmentation transforms email marketing into a precision tool. Marketers using segmented campaigns have seen a 760% increase in revenue compared to non-segmented efforts, along with a 100.95% jump in click rates [28][29]. This is especially important since 73% of B2B buyers deliberately avoid suppliers that send irrelevant messages [23].
Effective segmentation ensures that messages are tailored to the specific needs of key decision-makers. For example, Economic Owners prioritize ROI, Technical Validators focus on security and integration, and Champions seek tools they can advocate for internally. Firmographic data like company size and industry also plays a key role. A small startup might need straightforward, ROI-focused solutions, while a large enterprise may require detailed security and procurement information [28][23].
Behavioral segmentation takes this a step further by analyzing real-time actions, such as visits to pricing pages or content downloads. These insights help identify high-intent prospects and trigger automated follow-ups tailored to their current stage in the buying process. Emails triggered by behavior have been shown to generate 10x more revenue than generic campaigns [28]. Additionally, implementing a 90-day rule - splitting lists into "Active" (engaged within 90 days) and "Inactive" segments - can immediately improve deliverability and open rates by ceasing promotional emails to disengaged contacts [28][29].
| Segmentation Type | B2B Data Points | Impact on Performance |
|---|---|---|
| Firmographic | Company size, industry, revenue, geography | 30% higher open rates; aligns messaging with budget authority [28] |
| Behavioral | Pricing page visits, feature usage, email clicks | 10x revenue lift; identifies high-intent leads for immediate follow-up [28] |
| Lifecycle Stage | Lead, Trial User, Active Customer, Churned | Drives 25% of total revenue; ensures content matches the buyer's journey [28] |
| Engagement Tier | Active (30 days), Warm (90 days), Cold (180+ days) | Protects deliverability; reduces unsubscribes by 40% [28][29] |
Once you've personalized and segmented your emails, the next step is to optimize their design and calls-to-action (CTAs) to drive engagement. Scannability is key - use headers and bold text to highlight important sections, making it easier for busy professionals to quickly absorb the message [7]. A single, clear CTA keeps the focus sharp and actionable [7]. Given the prevalence of mobile email usage, ensuring your designs are mobile-friendly is non-negotiable, as poor mobile layouts can significantly hurt engagement [17][7].
For cold outreach, consider using low-pressure questions that encourage replies instead of pushing for aggressive sales. Align your subject line with the email body to maintain a high click-to-open rate [8]. CTAs should be benefit-driven, clearly explaining the next step after clicking. Regular A/B testing of CTA language, button placement, and subject lines is essential to fine-tune performance [4][8]. Adding social proof, such as testimonials or user-generated content, can also help build trust and showcase the value of your product [7]. Finally, simplify the conversion process by reducing the steps required to complete an action, whether it's a purchase or a sign-up [17].
"Click rate is a true indicator of customer engagement." - Erin Aguilar, Senior Customer Success Manager, Klaviyo [17]
Email marketing continues to be the most profitable digital channel for B2B companies, offering a $36–$42 return for every dollar spent [1][4]. To succeed in 2026, it's crucial to move past basic metrics like open rates - which have been inflated by 15–30% due to Apple’s iOS 15 privacy changes [27] - and focus instead on click-based engagement and revenue-driven outcomes that directly impact your business.
The shift from mass emailing to AI-driven personalization and behavior-based automation has completely changed the game. Automated workflows now generate 320% more revenue than manual campaigns, with revenue per email jumping from $0.15–$0.30 to $0.80–$2.50 [1]. Even more impressive, automation can significantly shorten B2B deal cycles, cutting conversion times from 45–90 days to just 20–40 days [1].
Deliverability is everything - if your emails don’t land in inboxes, even the best content won’t matter. To maintain strong inbox placement, keep bounce rates below 2% and spam complaints under 0.1%. Gmail and Yahoo, for instance, enforce strict spam thresholds of 0.3% [1][4][23][5].
Focus on engagement metrics that directly contribute to your sales pipeline, such as Click-Through Rate (CTR), Click-to-Open Rate (CTOR), Reply Rate, and Revenue per Recipient. These metrics highlight genuine buyer interest and help your sales team prioritize warm leads. For example, tracking repeated visits to your pricing page can provide valuable data for your CRM, enabling real-time prioritization and speeding up conversions [20].
It’s also worth noting that 73% of B2B buyers ignore irrelevant emails [23]. Instead of sending generic content, segment your audience based on their role, behavior, or stage in the buyer’s journey. A smaller, highly engaged email list will always outperform a larger, disengaged one - not just in terms of deliverability but also in revenue generation. These insights emphasize that precise segmentation and targeted engagement are essential for achieving long-term success in B2B email marketing by 2026.
Email marketing in 2026 revolves around three key metrics: click rate, deliverability/inbox placement, and engagement signals beyond open rates (such as conversions and tangible outcomes). These metrics have taken center stage as privacy measures tighten and open rates become less reliable. Shifting your attention to these actionable data points can provide a clearer picture of your email performance and help refine your strategies effectively.
To gauge engagement without relying on open rates, shift your attention to behavioral metrics. These include click-through rates, time spent reading, scrolling activity, link clicks, replies, and conversions. On the flip side, negative signals like unsubscribes or spam complaints can also shed light on how your audience is reacting. Since privacy updates have made open rates less dependable, these metrics give a clearer picture of engagement. Focusing on these behaviors allows you to better understand subscriber interests and fine-tune your campaigns for success.
To keep tabs on Revenue Per Email (RPE) in your CRM, start by dividing the total revenue generated from your email campaigns by the number of emails sent. This simple calculation gives you a clear picture of how much revenue each email contributes.
To boost conversions, focus on using behavioral segmentation to tailor your messages and craft structured, compelling copy. Also, make sure your CRM syncs seamlessly with your email platform. This integration lets you track replies, conversions, and sales directly, making it easier to tie specific revenue back to individual emails or sequences. This way, you can measure ROI with precision.
%20(5).png)
