%20Bold.png)
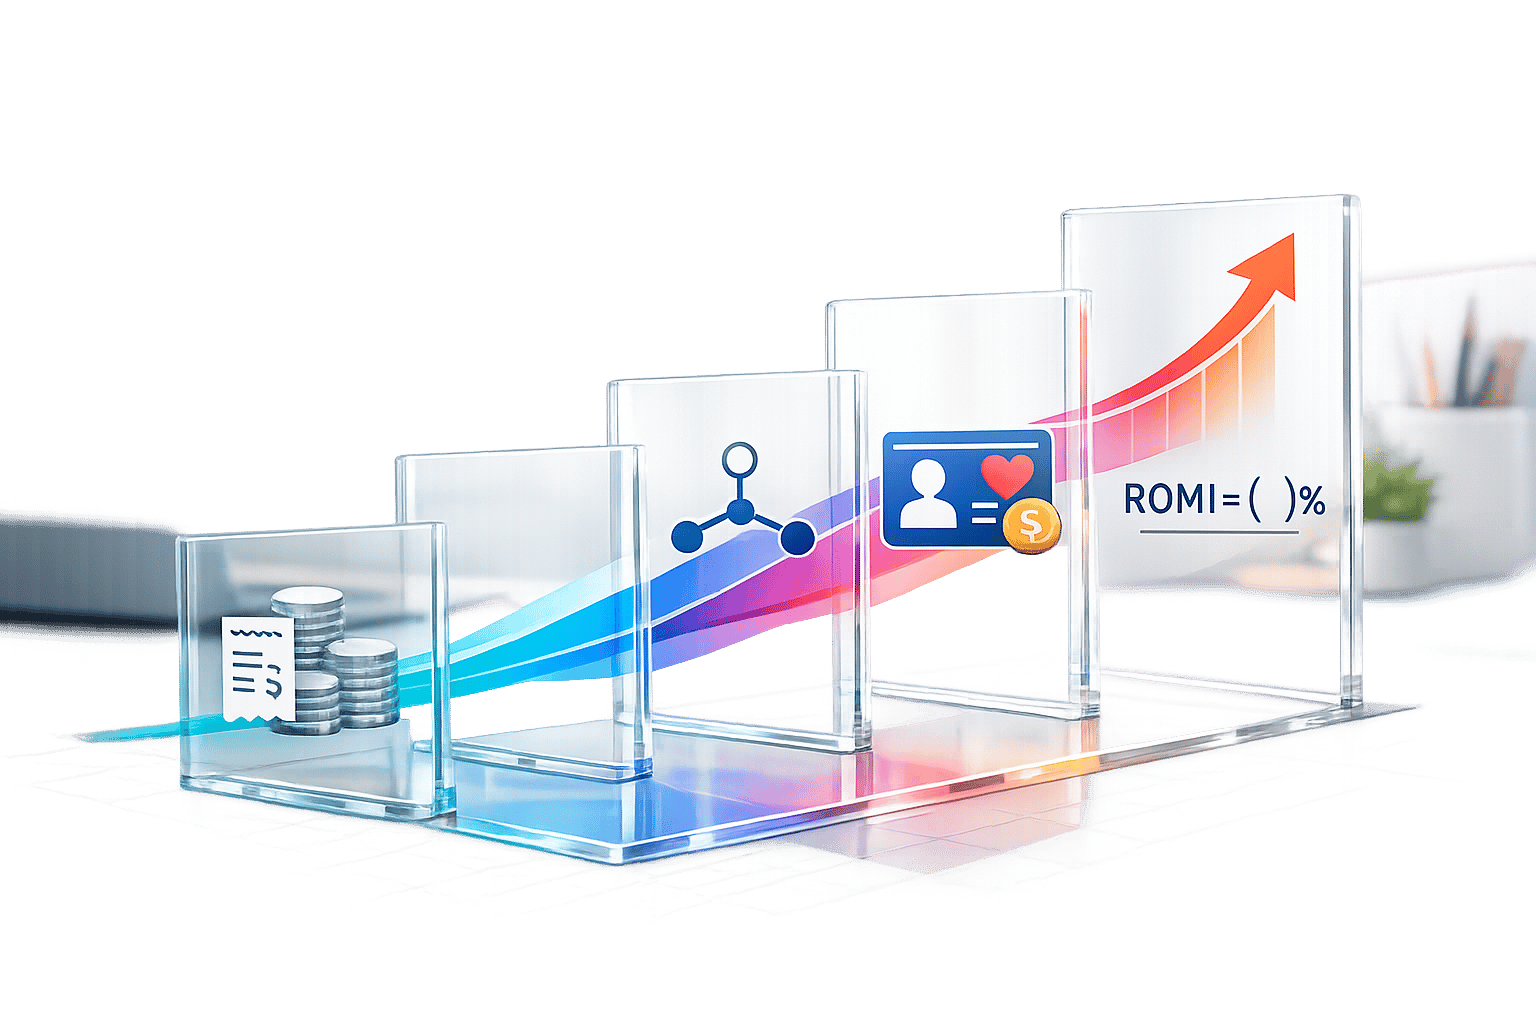
Return on Marketing Investment (ROMI) is a simple yet powerful way to measure how effectively your marketing spend generates revenue. The formula is:
ROMI = [(Revenue from Marketing - Marketing Cost) / Marketing Cost] × 100
To improve ROMI, track all costs, use multi-touch attribution, and automate data collection. For long-term growth, consider integrating metrics like Customer Lifetime Value (CLV).
The Return on Marketing Investment (ROMI) formula is simple:
ROMI = [(Revenue from Marketing – Marketing Cost) / Marketing Cost] × 100%
This formula shows how much revenue your marketing efforts generate for every dollar spent.
It breaks down into two key parts:
Here’s an example: A SaaS company spends $50,000 on a LinkedIn lead generation campaign. The breakdown includes $30,000 for ads, $10,000 for creative production, and $10,000 for staff time. The campaign brings in 10 new enterprise contracts worth $200,000 in revenue. Plugging the numbers into the formula:
[($200,000 – $50,000) / $50,000] × 100% = 300%
This means that for every $1 invested, the company earns $3 in profit after covering marketing costs.
Results can be presented as a percentage (e.g., 300%) or as a ratio (e.g., 3:1). Both formats convey the same idea: for every $1 spent, $3 in revenue is generated. A ROMI of 100% (or 1:1) represents the break-even point - where revenue equals the cost, leaving no profit. This clarity makes it easier to evaluate marketing outcomes.
Interpreting ROMI values is crucial for understanding your campaign's success.
On the flip side, a negative ROMI (e.g., –50%) means your campaign's revenue didn't even cover its costs. This signals an urgent need to rethink your strategy.
Valerie Fenske, Growth Marketer at Dashly, emphasizes the importance of tracking ROMI:
"If you're not tracking ROMI, you're flying blind" [5].
Using robust marketing analytics can lead to a 15–20% improvement in ROI [3], making ROMI an invaluable metric for B2B leaders who want to justify budgets and highlight the value of their strategies.

How to Calculate ROMI: 3-Step Process with Formula and Benchmarks
Let’s break down the process of calculating ROMI using a practical, step-by-step approach.
Start by accounting for all marketing-related expenses. This includes your media spend, creative production costs, personnel expenses, technology fees, and any promotional activities. Don’t make the mistake of focusing solely on ad spend - it’s a common error that can lead to inaccurate calculations.
For example, if you spent $30,000 on LinkedIn ads, but also invested $10,000 in creative work and $10,000 in staff time, your total marketing cost is actually $50,000 - not just the $30,000 ad spend. Additionally, if you’re working with long-term content assets, remember to spread those costs over their effective lifespan for a clearer picture [3].
Once you’ve tallied every dollar spent, it’s time to move on to the next step: connecting those costs to the revenue they generate.
Assigning revenue to specific marketing efforts can be tricky, especially in B2B settings where sales cycles tend to be longer. The key is selecting an attribution model that reflects your customer journey:
For businesses dealing with extended sales cycles, consider using pipeline metrics like Marketing Qualified Leads (MQLs) or estimated pipeline value as interim indicators. Establishing a sales baseline - revenue generated without marketing - can also help isolate the true incremental impact of your campaigns [3].
With both costs and revenue properly aligned, you’re ready to calculate your ROMI.
Now that you’ve gathered your marketing costs and the revenue tied to your efforts, plug these numbers into the ROMI formula:
ROMI = (Revenue – Marketing Costs) / Marketing Costs × 100
Here’s an example: If a campaign costs $27,000 and brings in $75,000 in revenue, the calculation looks like this:
($75,000 – $27,000) / $27,000 × 100 = 178%
This result means the campaign generated $1.78 for every $1 spent. While this outcome is profitable, it falls short of the 500% benchmark often used to define a highly effective marketing engine [1][2].
The basic ROMI formula is a great starting point, but it doesn’t always capture the full picture, especially for businesses with complex sales cycles or recurring revenue. To truly understand profitability, you need to go beyond top-line revenue and refine your calculations. These advanced formulas help you dig deeper and align your marketing efforts with overall business goals.
Instead of using raw revenue, this formula factors in gross profit - your revenue minus the Cost of Goods Sold (COGS). The formula looks like this:
ROMI = (Gross Profit from Marketing – Marketing Cost) / Marketing Cost
Here’s an example: If a campaign generates $100,000 in revenue but your COGS is $60,000, your gross profit is $40,000. By focusing on gross profit, you can identify campaigns that bring in revenue but fail to deliver meaningful profit [1].
This formula takes it a step further by incorporating all costs, including overhead and operational expenses:
ROMI = (Net Profit from Marketing / Total Marketing Cost) × 100
This method appeals to CFOs because it ties marketing efforts directly to metrics like EBITDA and cash flow. It shifts the perception of marketing from being a cost center to being a growth driver. Companies using this approach have reported improvements in marketing ROI by as much as 15–20% [3].
For businesses that rely on repeat customers, such as SaaS or subscription models, integrating Customer Lifetime Value (CLV) into your ROMI calculation provides a more comprehensive view of marketing effectiveness. The formula is:
ROMI = [(CLV × Number of New Customers – Marketing Investment) / Marketing Investment] × 100%
This approach is especially helpful for businesses with long sales cycles or multiple touchpoints before purchase. For example, SaaS companies often see customers interact with an average of 13 pieces of content before converting, and their sales cycles can span 3–6 months. By factoring in CLV, these companies can justify higher acquisition costs, retain more customers, and align marketing strategies with long-term growth. Top-performing companies in this space often achieve ROMI rates of 200% or higher, with some reaching 500% [3].
Here’s a quick comparison of these advanced ROMI models:
| ROMI Type | Formula | Best For |
|---|---|---|
| Gross Profit-Adjusted | (Gross Profit from Marketing – Marketing Cost) / Marketing Cost | Physical goods, services with high COGS |
| Net Profit-Based | (Net Profit from Marketing / Total Marketing Cost) × 100 | CFO alignment, bottom-line impact |
| CLV-Based | [(CLV × New Customers – Marketing Investment) / Marketing Investment] × 100% | SaaS, subscriptions, repeat customers |
Even small missteps in ROMI calculations can lead to wasted budgets and poor decision-making. Knowing where issues typically arise can help you create a more dependable system from the outset.
One of the most common pitfalls is incomplete cost accounting - failing to include indirect costs like creative fees or software expenses alongside direct ad spend. This mistake inflates ROMI by underestimating total costs, which can misrepresent marketing's true value to stakeholders [1][3].
Another frequent issue is improper revenue attribution. Relying solely on last-click attribution overlooks earlier customer interactions in the buyer's journey. This approach often results in underfunding critical awareness campaigns while over-investing in channels that don’t provide incremental value [4].
Failing to establish a sales baseline is another major error. A baseline represents the revenue that would occur without any marketing activities. Without it, marketing efforts may be credited for sales that would have happened anyway, inflating ROMI and masking inefficiencies [1][6]. Additionally, many calculations neglect the "price waterfall" - factors like discounts, returns, and shipping costs that reduce actual margins [4].
Take HarborHome, for example, a $500M home essentials brand. In 2025, the company discovered that affiliate marketing was being over-credited for sales due to overlapping coupon usage. By using Marketing Mix Modeling, they identified that incremental lift was only half of what platforms claimed. After reallocating $20M in marketing spend, they improved their blended ROMI from 1.2 to 1.55 in just two quarters [4].
Avoid these errors by following proven methods to ensure your ROMI calculations are reliable.
"Improvado allows us to have all information in one place for quick action... we save about 80% of time for the team." - Kasia Pasich, Data Analyst, Yodel Mobile [1]
ROMI (Return on Marketing Investment) reframes marketing as a driver of growth rather than just an expense. The formula - (Revenue from Marketing - Marketing Cost) / Marketing Cost - is a good starting point, but achieving true accuracy means digging deeper. This involves tracking all costs thoroughly, implementing multi-touch attribution, and accounting for your sales baseline [1].
To refine your approach, consider using Gross Profit-Adjusted ROMI or factoring in Customer Lifetime Value (CLV), especially for subscription-based or repeat-purchase businesses. These methods highlight sustainable, long-term growth [1][3]. While a 5:1 return ratio (500%) is often the gold standard, SaaS companies should aim for at least a 200% return to maintain steady growth [1][6].
Common mistakes to avoid include incomplete cost tracking, poor revenue attribution, and overlooking time-lag analysis - especially important for longer sales cycles. Automating data unification can cut reporting time by up to 80%, reducing errors and freeing your team to focus on strategy [1]. The goal is to create a shared, data-driven framework that aligns marketing, finance, and leadership around revenue objectives.
With these strategies, you're equipped to improve your marketing ROI and make data-backed decisions that drive results.
Start by centralizing your marketing data. Pull insights from your CRM, ad platforms, and analytics tools to get a full picture of your performance. Establish a clear sales baseline to measure the true incremental impact of your marketing efforts. Then, implement multi-touch attribution to understand the complete customer journey [1][4].
For B2B leaders in industries like finance, real estate, SaaS, or consulting who want to accelerate revenue growth, Visora provides tailored Revenue Advisory services. Their approach combines AI-driven business development, strategic partnerships, and private market insights. In just 12 weeks, they can help you build exclusive deal pipelines, connect with ideal prospects, and shorten deal cycles - all without relying on referrals, excessive ad spend, or an oversized team.
Finally, automate data unification to reduce manual errors and allocate budgets more effectively. As the Monetizely SaaS Guide puts it, "ROMI isn't just a metric - it's a management philosophy that turns marketing into a strategic growth engine" [3].
When calculating ROMI (Return on Marketing Investment), make sure to include all marketing-related expenses. These typically consist of:
Avoid including non-marketing costs such as production expenses, general payroll, rent, or operational costs. Stick to expenses that are directly connected to your marketing efforts. This approach ensures your calculation stays accurate and focused.
Picking the best attribution model for measuring Return on Marketing Investment (ROMI) starts with understanding your marketing objectives and the key touchpoints in your customer journey. Different models work better for different scenarios:
The goal is to select a model that fits your strategy, simplifies ROI tracking, and helps you make smarter decisions to improve your ROMI.
Instead of focusing solely on short-term returns, consider using customer lifetime value (CLV) to measure the long-term profitability of your marketing efforts. This approach gives a broader perspective on how effective your campaigns are, especially when your goal is to nurture enduring customer relationships and boost lifetime revenue. It's especially useful in industries where repeat business and customer loyalty play a major role in success.
%20(5).png)
