%20Bold.png)
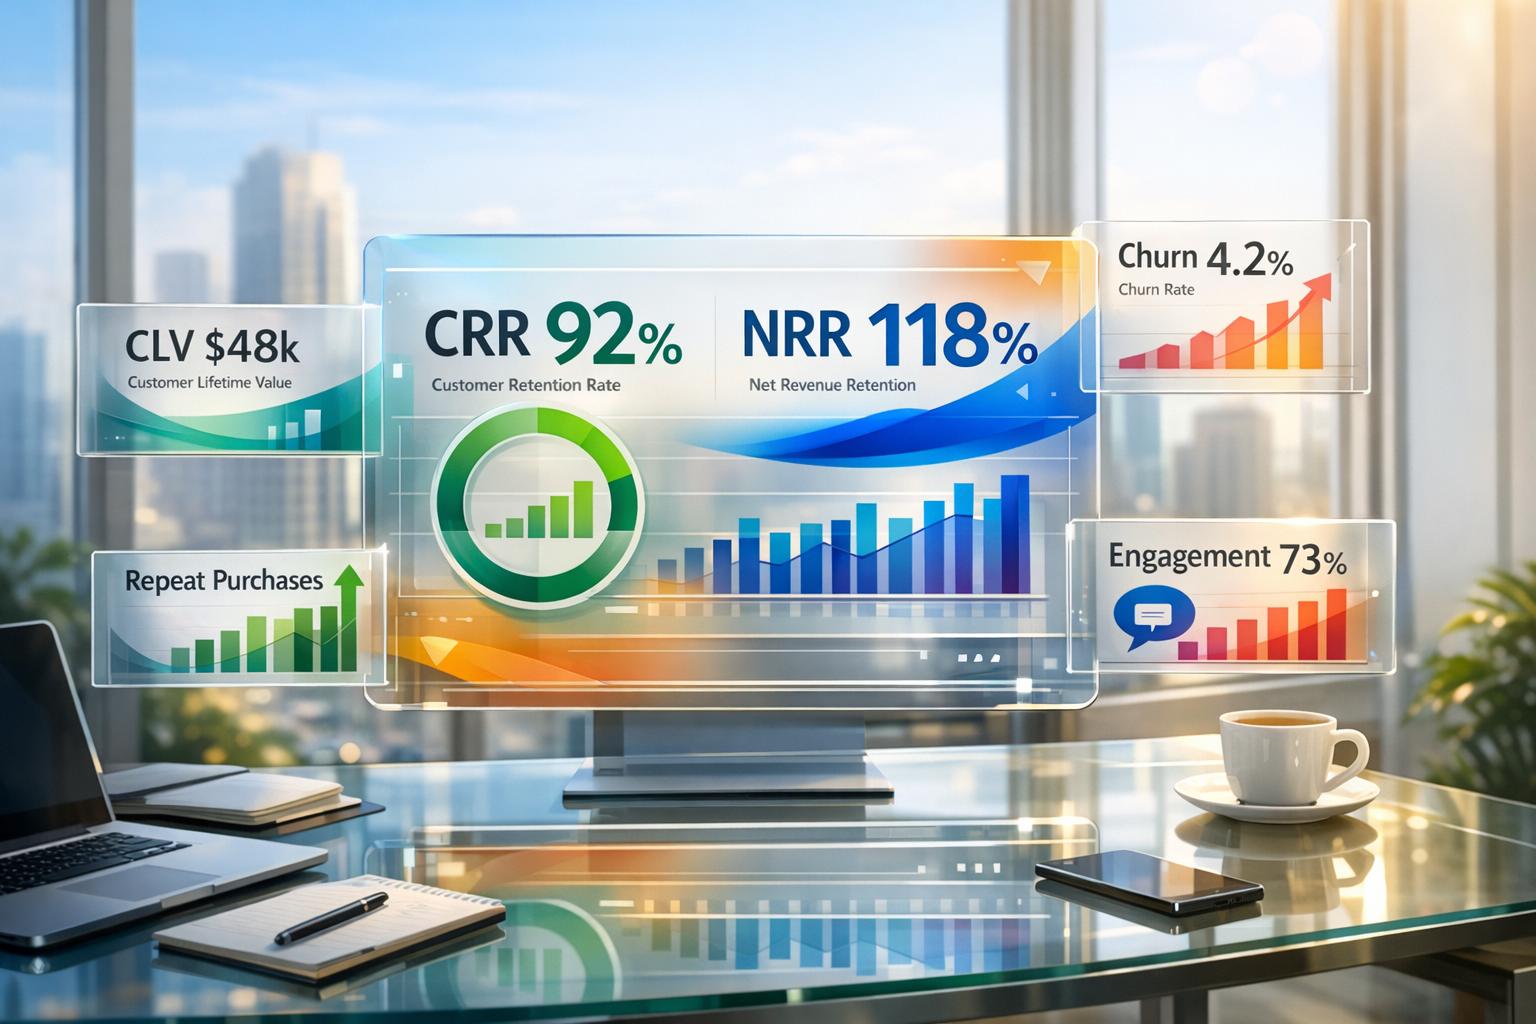
Customer retention metrics are essential for businesses to measure loyalty, identify revenue opportunities, and reduce churn. In B2B, where long-term relationships and recurring revenue matter most, these metrics help leaders track performance and make data-driven decisions. Here's a quick breakdown of the key takeaways:
Retention isn't just about keeping customers - it’s about maximizing their value. By focusing on metrics like CRR, NRR, and CLV, businesses can improve profits by up to 95% with just a 5% increase in retention. Start tracking these metrics to build stronger customer relationships and drive long-term growth.
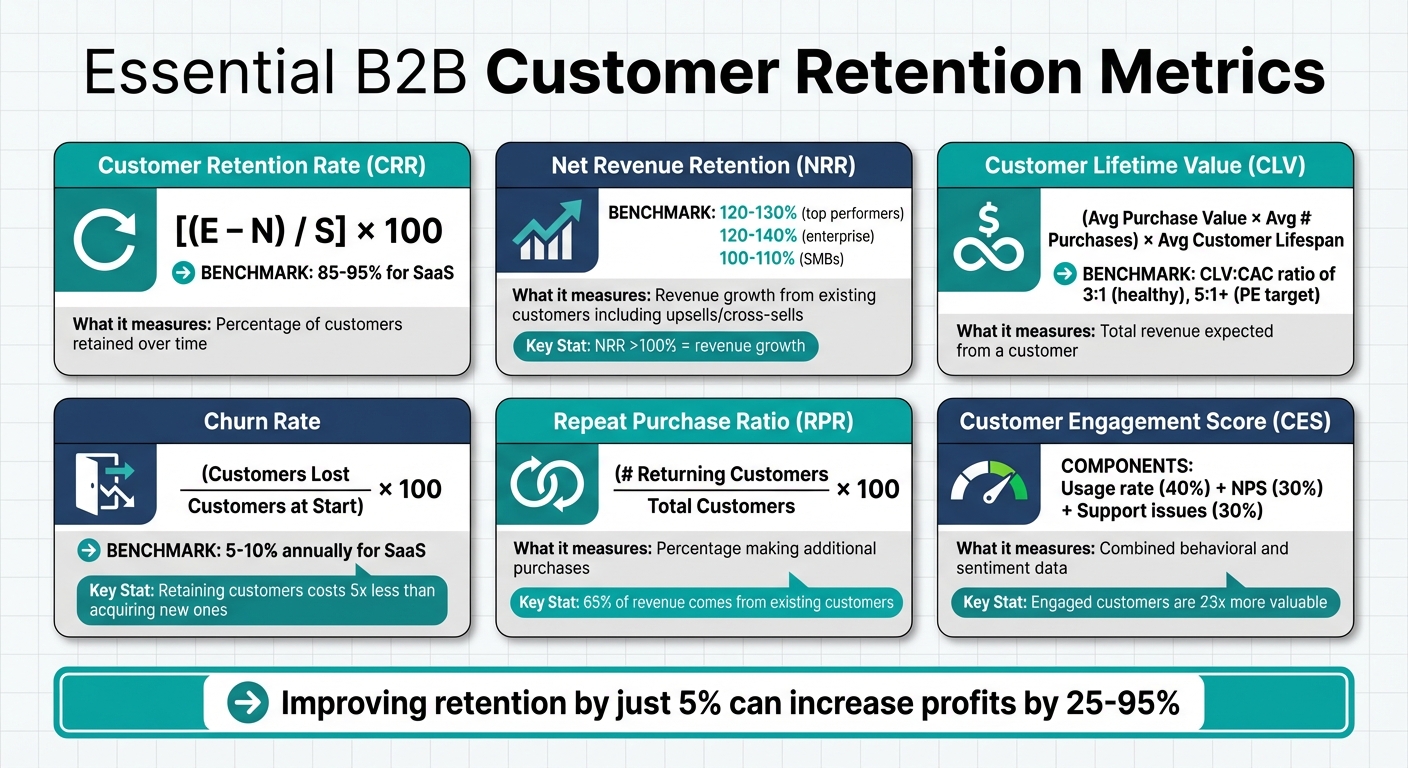
6 Essential B2B Customer Retention Metrics and Benchmarks
Customer Retention Rate (CRR) shows the percentage of customers your business keeps over a specific time frame [3][4]. It’s essentially the opposite of churn rate and serves as a key measure of how well your retention strategies are working. This is especially important for B2B companies that rely on long-term relationships and recurring revenue [2][6].
The formula for CRR is: [(E – N) / S] x 100, where:
For example, if you start January with 100 customers, gain 20 new ones, and end with 110, your CRR would be [(110 – 20) / 100] x 100 = 90%. In the SaaS world, CRR benchmarks often fall between 85% and 95% [6]. Regularly tracking CRR - whether monthly, quarterly, or annually - and breaking it down by product or service can help you spot patterns and areas needing attention.
While CRR focuses on customer retention, Net Revenue Retention (NRR) goes one step further by examining revenue growth within the existing customer base.
Net Revenue Retention (NRR) measures whether your revenue from current customers is growing or shrinking over time. It factors in revenue from upsells, downgrades, and cancellations [9]. Unlike CRR, which tracks customer numbers, NRR provides a clearer picture of overall revenue health and helps identify organic growth potential.
An NRR above 100% signals that your existing customer base is driving revenue growth. Companies with an NRR exceeding 110% often grow 2.5 times faster than those with an NRR below 100% [7]. For top-performing B2B SaaS companies, NRR targets typically range from 120–130%, with enterprise firms achieving 120–140%, compared to 100–110% for SMBs [6][9].
The first 90 days of onboarding are critical. Customers who fail to hit activation milestones within the first 30 days are three times more likely to churn. Strategies like trigger-based campaigns (e.g., offering tier upgrades when customers hit 80% of their usage limit), encouraging annual contracts over monthly ones, and tracking metrics like daily active users and feature adoption can help reduce churn risks within 30–60 days.
For a deeper understanding of long-term customer value, Customer Lifetime Value (CLV) is essential.
Customer Lifetime Value (CLV) measures the total revenue you can expect from a customer throughout your relationship. It complements CRR and NRR by helping you allocate resources wisely and focus on accounts that matter most [1][5][6]. A high CLV often reflects strong loyalty, effective recurring revenue strategies, and a good fit between your product and market [4].
For B2B services, calculate CLV as:
(Average Purchase Value × Average Number of Purchases) × Average Customer Lifespan [1][3][4].
In subscription models, it’s often calculated as:
Average Revenue Per User (ARPU) ÷ Churn Rate [6].
Comparing CLV to Customer Acquisition Cost (CAC) is critical. A healthy ratio is generally 3:1, with venture investors expecting this benchmark and private equity buyers sometimes aiming for 5:1 or more. If your ratio hits 7:1, it might mean you’re not investing enough in growth [10].
Segmenting customers by CLV helps you identify high-value accounts and tailor retention strategies. For example:
Streamlining Time to Value (TTV) - the time it takes for a customer to see benefits - can also strengthen loyalty. Studies suggest that about 80% of value creation in successful companies comes from existing accounts [4].
These metrics go beyond CRR, NRR, and CLV, offering deeper insights into customer behavior and satisfaction.
Customer churn rate measures the percentage of customers who stop using your product or service within a specific time frame [11][3]. While retention highlights who stays, churn reveals who leaves - both are crucial for B2B success.
The formula for churn is: (Customers Lost / Customers at Start) × 100 [11][3][1]. For example, if you start a quarter with 200 customers and lose 10, your churn rate is 5%. On average, SaaS companies lose between 5% and 10% of their customers annually [11], though this varies widely depending on company size and market segment.
In B2B, churn often clusters around annual or multi-year renewal cycles, unlike the steady month-to-month churn seen in B2C [12]. This makes it essential to track leading indicators at least 90 days before contract renewals. Research indicates 70% to 80% of churned customers show warning signs - like reduced logins, lower feature usage, or more support tickets - at least 30 days before leaving [12].
Churn comes in two forms: voluntary and involuntary. Voluntary churn happens when customers leave due to dissatisfaction, pricing, or competitors. Involuntary churn stems from issues like failed payments or expired credit cards [11][12]. Involuntary churn can make up 20% to 40% of total churn [11][12], but it’s often easier to address. Advanced dunning systems can recover 70% to 85% of failed payments, compared to 40% to 60% with basic tools [12].
The financial stakes are high. Retaining a customer costs five times less than acquiring a new one [3][1][5], and improving retention by just 5% can increase profits by 25% to 95% [11][3][1]. To reduce churn, use smart retry logic for failed payments, automate dunning emails (immediately, at 3 days, and at 7-14 days post-failure), and monitor early warning signs through cohort analysis [11]. Breaking customers into groups based on signup month or acquisition source can reveal patterns that a simple snapshot might miss [11].
| B2B Segment | Annual Logo Churn Benchmark |
|---|---|
| Early-stage (<$1M ARR) | 10% - 20% [12] |
| Growth-stage ($1M-$10M ARR) | 5% - 10% [12] |
| Mid-market ($10M-$50M ARR) | 3% - 7% [12] |
| Enterprise ($50M+ ARR) | 2% - 5% [12] |
Beyond churn, tracking repeat purchases is another way to measure customer loyalty.
The Repeat Purchase Ratio (RPR) measures the percentage of customers who make additional purchases after their first transaction [3][16]. In B2B, this metric reflects whether your product or service solves recurring problems effectively enough to bring customers back [8].
The formula is: (Number of Returning Customers / Total Number of Customers) × 100 [4][8]. A high RPR indicates strong product-market fit and shows that customers see enough value to continue investing. Roughly 65% of a company’s revenue typically comes from existing customers [8], and 80% of future revenue is expected to come from just 20% of current customers [8]. This makes RPR a key metric for identifying high-value segments and allocating resources wisely.
To boost RPR, segment customers by value and target personalized content to "Promoters" or high-value accounts [5][8]. If your RPR drops, combine quantitative data with qualitative feedback from customer satisfaction scores or NPS to identify whether issues stem from onboarding, product features, or support [2]. Also, track time between purchases - a shorter gap suggests higher satisfaction and eagerness for additional solutions [3].
While churn and repeat purchase ratios measure outcomes, engagement scores reveal the underlying customer sentiment and behavior.
The Customer Engagement Score (CES) acts as a key indicator of retention health [5][13]. Unlike one-dimensional metrics like NPS, CES combines behavioral data (logins, feature adoption) with sentiment to offer a complete picture of an account’s status [13].
Engaged customers are 23 times more valuable than new ones [14], and businesses with strong multichannel engagement retain 89% of their customers on average [14]. Additionally, lifetime value increases by 25% when companies engage customers across multiple channels [14].
Engagement in B2B is more complex since multiple stakeholders - executives, managers, and end-users - must all find value in the product [14]. A common scoring model might weigh usage rate (40%), NPS (30%), and support issues (30%) [1]. Key data points include product logins, core feature usage, email opens, and website visits [5][1].
Use engagement scores to prioritize accounts for action. Healthy accounts (80-100) are ready for upselling or testimonials. Stable accounts (60-79) may need friction points addressed. At-risk accounts (40-59) require targeted recovery efforts, while Critical accounts (0-39) need immediate attention [13]. Automated alerts for dips in usage or missed milestones can help your team act before customers churn [13]. With the median session duration for B2B companies at just 1.3 minutes [15], it’s crucial to deliver value quickly and ensure customers achieve meaningful outcomes early in their journey [5][1].
Retention metrics are often overlooked in favor of chasing new clients, but they’re essential for long-term revenue growth. Visora’s Trifecta Program flips the script by integrating retention analysis right at the acquisition stage. The idea? Focus on prospects who are likely to stick around, grow their accounts, and generate steady revenue over time. After all, the quality of acquisition has a direct impact on the lifetime value of an account.
The Trifecta Program is built on three targeted strategies designed to boost growth:
| Trifecta Component | Primary Metrics | Strategic Impact |
|---|---|---|
| B2B Vortex Funnel | NRR, CLV | Drives long-term value and expansion revenue[5][6] |
| AI-Augmented Appointment Setting | CRR, Churn Rate | Lowers churn by targeting high-fit prospects[1][17] |
| DD Strategic Advisory | Engagement Score, Revenue Growth | Enhances customer interactions and revenue growth[4][5] |
One of the program’s standout features is its ability to maintain a CLV-to-CAC ratio of at least 3:1[6], a gold standard for sustainable growth. By focusing on prospects with strong retention potential, the program shortens sales cycles and ensures predictable revenue growth - without relying on costly referrals or inflated ad spend. It’s a clear example of how retention metrics can drive a business’s overall success.
Retention metrics are only as good as the actions they inspire. These strategies focus on turning data into meaningful improvements.
Start by creating a comprehensive data collection system that gathers insights from all major customer touchpoints. This means integrating tools like your CRM (e.g., Salesforce or HubSpot), billing platforms (e.g., Stripe or Chargebee), and customer success software (e.g., Gainsight) into a single dashboard[20]. The idea is to automate the tracking of product usage, support ticket trends, customer success updates, and billing behavior, eliminating the need for manual input[19].
Keep your data clean and accurate. Regularly update customer records, remove duplicates, and flag inactive accounts to ensure your metrics are reliable[20]. Poor data hygiene could lead you to chase the wrong accounts while missing those that need immediate attention. Set up automated alerts for critical behaviors - like when a customer hasn’t logged in for 14 days or if support ticket activity suddenly drops. These can act as early warnings of disengagement[7].
Once your data is flowing, establish a routine for reviewing it. Align reporting schedules with your billing cycles and customer engagement patterns. For many B2B companies, monthly reviews are effective, while quarterly analyses can uncover seasonal trends and long-term patterns[20]. Focus on leading indicators like daily active users (DAU), feature adoption rates, and session frequency. These metrics often predict churn 30 to 60 days in advance[7].
Use cohort analysis to uncover key moments, especially during onboarding (the first 0 to 3 months). Tracking early activation milestones can help you spot and address churn risks before they escalate. Businesses that consistently monitor these retention metrics are 12% more likely to hit their revenue goals[21].
By regularly reviewing data, you can adjust your strategies to address different levels of customer risk.
Retention data becomes most valuable when used to segment customers by risk levels - low, medium, and high - based on churn probability scores[19]. This segmentation allows you to allocate resources strategically:
To make this work, ensure your Marketing, Customer Success, and Product teams are aligned through a shared dashboard. Retention should be a company-wide focus, not just a Customer Success responsibility[19]. Insights from retention data can also refine your onboarding process, pricing, and product development to better serve customer needs.
And here’s a compelling reason to prioritize retention: improving it by just 5% can increase profits by 25% to 95%[1][3]. That’s a growth lever no business can afford to ignore.
Customer retention metrics aren't just numbers on a dashboard - they're the backbone of sustainable growth in the B2B world. For leaders striving to grow efficiently, retention offers the most effective path forward.
The metrics discussed here - like Customer Retention Rate, Net Revenue Retention, and Customer Lifetime Value - provide a detailed understanding of your customer relationships. Considering that 80% of future revenue is expected to come from just 20% of your current customers[8], focusing on the right accounts and strategies is vital. These metrics lay the groundwork for retention strategies that deliver tangible results.
The real challenge lies beyond understanding these metrics. Success depends on building systems that not only track them accurately but also turn insights into actionable plans. Effective retention strategies require seamless data integration, consistent monitoring, and collaboration across teams like Marketing, Customer Success, and Product. Embedding these insights into your operations is key to achieving sustainable growth. For industries like real estate syndication, financial services, and commercial real estate, Visora's Trifecta Program offers a solution. It combines the B2B Vortex Funnel, AI-Augmented Appointment Setting, and DD Strategic Advisory to help create retention-focused systems in just 12 weeks - without the need for referrals or expanding your team unnecessarily.
Start by identifying the retention metric that matters most to your business. Use its insights to guide your strategy, and build a strong customer success framework that transforms your current customers into your most valuable growth drivers.
Start with the Customer Retention Rate - a key metric that shows the percentage of customers who stick with you over a given time. It’s a solid indicator of both loyalty and satisfaction. Why does it matter? Because keeping existing customers is often cheaper than finding new ones. Plus, it helps build long-term growth by strengthening loyalty and ensuring more consistent revenue.
To figure out Net Revenue Retention (NRR), you need to evaluate how much revenue you keep and grow from your existing customers over a certain period, while factoring in churn, reductions, and upsells. The formula looks like this: NRR = [(Starting Revenue + Expansion Revenue - Contraction Revenue - Churned Revenue) / Starting Revenue] × 100%.
If your NRR is above 100%, it signals growth from your existing customer base. On the other hand, an NRR below 100% suggests that losses from churn and reductions are outweighing any gains.
Monitoring leading indicators of churn in B2B is crucial for keeping customers engaged and satisfied. Key signs include declining product usage, such as fewer logins or a noticeable drop in feature adoption. Other important metrics to watch are customer health scores and engagement levels.
Additionally, an increase in support tickets or a falling Net Promoter Score (NPS) can indicate dissatisfaction. Keeping a close eye on these trends gives businesses the chance to tackle problems early, boost satisfaction, and ultimately lower churn rates.
%20(5).png)
