%20Bold.png)

Financial benchmarking in 2025 has been reshaped by AI, offering tools with real-time data, natural language queries, and predictive analytics. Despite these advancements, 71% of companies still rely on static spreadsheets, missing out on faster, more accurate solutions. The best tools now integrate seamlessly with systems like ERP and CRM, automate forecasting, and provide in-depth insights to improve decision-making. Key features to look for include real-time data integration, AI-powered analytics, customizable dashboards, and multi-entity consolidation.
Here’s what you need to know about the top tools and how they compare.
When selecting a financial benchmarking tool, look for features that go beyond basic reporting. Real-time data integration is a must-have. The best tools connect seamlessly with your ERP, CRM, HRIS, and accounting systems - think Xero, QuickBooks, or NetSuite. This eliminates the need for manual imports and prevents data fragmentation. With dashboards that update as soon as transactions are posted, finance leaders can identify cash flow issues or covenant risks immediately, instead of relying on outdated, end-of-month reports [3].
AI-powered predictive analytics is another game-changer. Advanced tools now use AI and machine learning to deliver forecasts free from bias, detect anomalies, and uncover trends in historical data. These systems are incredibly efficient, identifying about 95% of material issues compared to just 65% with manual reviews [7]. Nicolas Boucher, a finance leader, summed it up perfectly:
"AI is here to stay and ignoring it would be like ignoring Excel when it was released 40 years ago." [6]
Customization is key when it comes to reporting and dashboards. Look for tools with drag-and-drop widgets, customizable KPI builders, and the ability to drill down from summaries to detailed data. Role-specific views are also helpful, offering tailored insights for partners, deal teams, and department managers. Industry-specific templates can speed up reporting and provide polished, board-ready insights.
For growing businesses, multi-entity consolidation is crucial. Choose a tool that can handle complex organizational structures, intercompany eliminations, and multi-currency translations. Automated FX gain/loss management is especially important. Picking a scalable platform now can save you from costly upgrades or migrations down the line.
Finally, don’t overlook auditability and security. Financial tools must offer enterprise-level protections, such as SOC 2 Type II certification, GDPR compliance, full audit trails, version control, and role-based access. When it comes to AI-driven insights, platforms should provide clear reasoning or citations to ensure that conclusions can be defended to boards and regulators [4].
These features are essential for evaluating the top financial benchmarking tools of 2025.
These tools showcase the advanced integration and AI-powered analytics shaping the financial industry.
Bloomberg Terminal is the gold standard for real-time market data and execution. It offers comprehensive cross-asset coverage and real-time updates, making it a preferred choice for financial professionals who rely on up-to-the-second information. The platform also features BloombergGPT, an AI model designed for financial language processing, which allows users to query market data more naturally [9] [4].
However, this level of depth comes at a price - about $31,980 annually per user, with discounts available for multiple licenses, bringing the cost to around $28,320 per terminal [9]. While the pricing is high, its robust capabilities are particularly beneficial for investment banking and asset management teams. That said, users often highlight its steep learning curve and outdated interface as drawbacks [9].
S&P Capital IQ Pro excels in its coverage of both public and private company financials. Powered by Kensho - an AI-driven analytics engine - it supports forecasting and macro scenario modeling [4]. The platform goes beyond standard GAAP measures, offering access to industry-specific metrics and advanced screening tools. For instance, users can analyze non-GAAP KPIs like the "Rule of 40" for SaaS companies or RevPAR (Revenue Per Available Room) for real estate investments [10].
Its standout feature is its ability to standardize disparate financial data, making cross-company comparisons more consistent and audit-ready. This functionality makes it a reliable resource for analysts needing detailed, customizable insights.
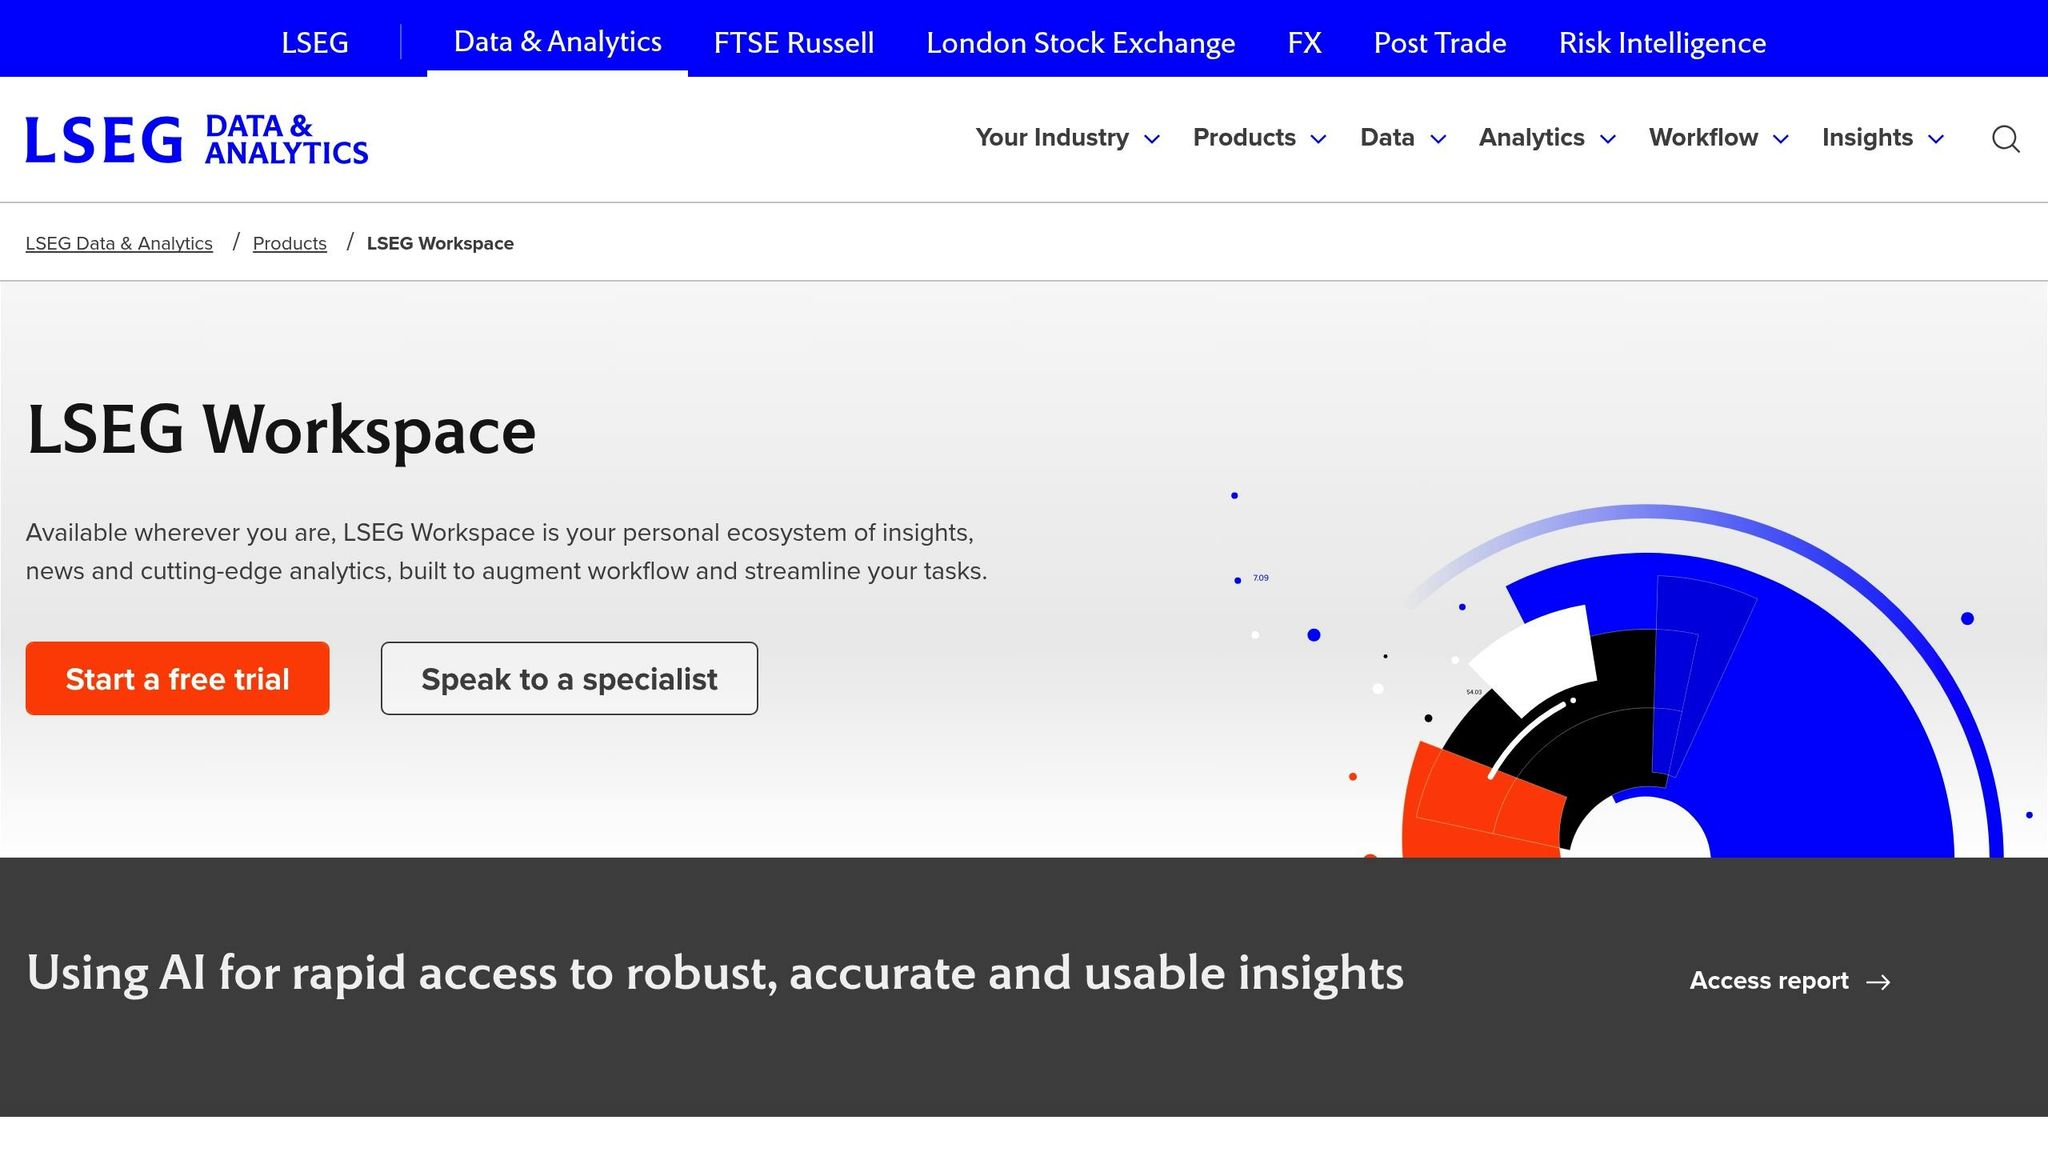
Formerly known as Refinitiv Eikon, LSEG Workspace is a cloud-based solution that integrates Reuters news feeds with macroeconomic data and ESG metrics. Designed for financial analysts, it consolidates market trends, regulatory updates, and environmental, social, and governance (ESG) factors into a single platform. Its cloud-native design ensures seamless access to data and workflows from anywhere, eliminating the need for legacy hardware.
The platform’s emphasis on ESG data makes it particularly useful for investor relations professionals and commercial real estate leaders, who face growing demands to report on sustainability metrics. LSEG Workspace provides standardized ESG scores and tools for tracking disclosures, enabling users to benchmark against competitors and meet stakeholder expectations effectively.
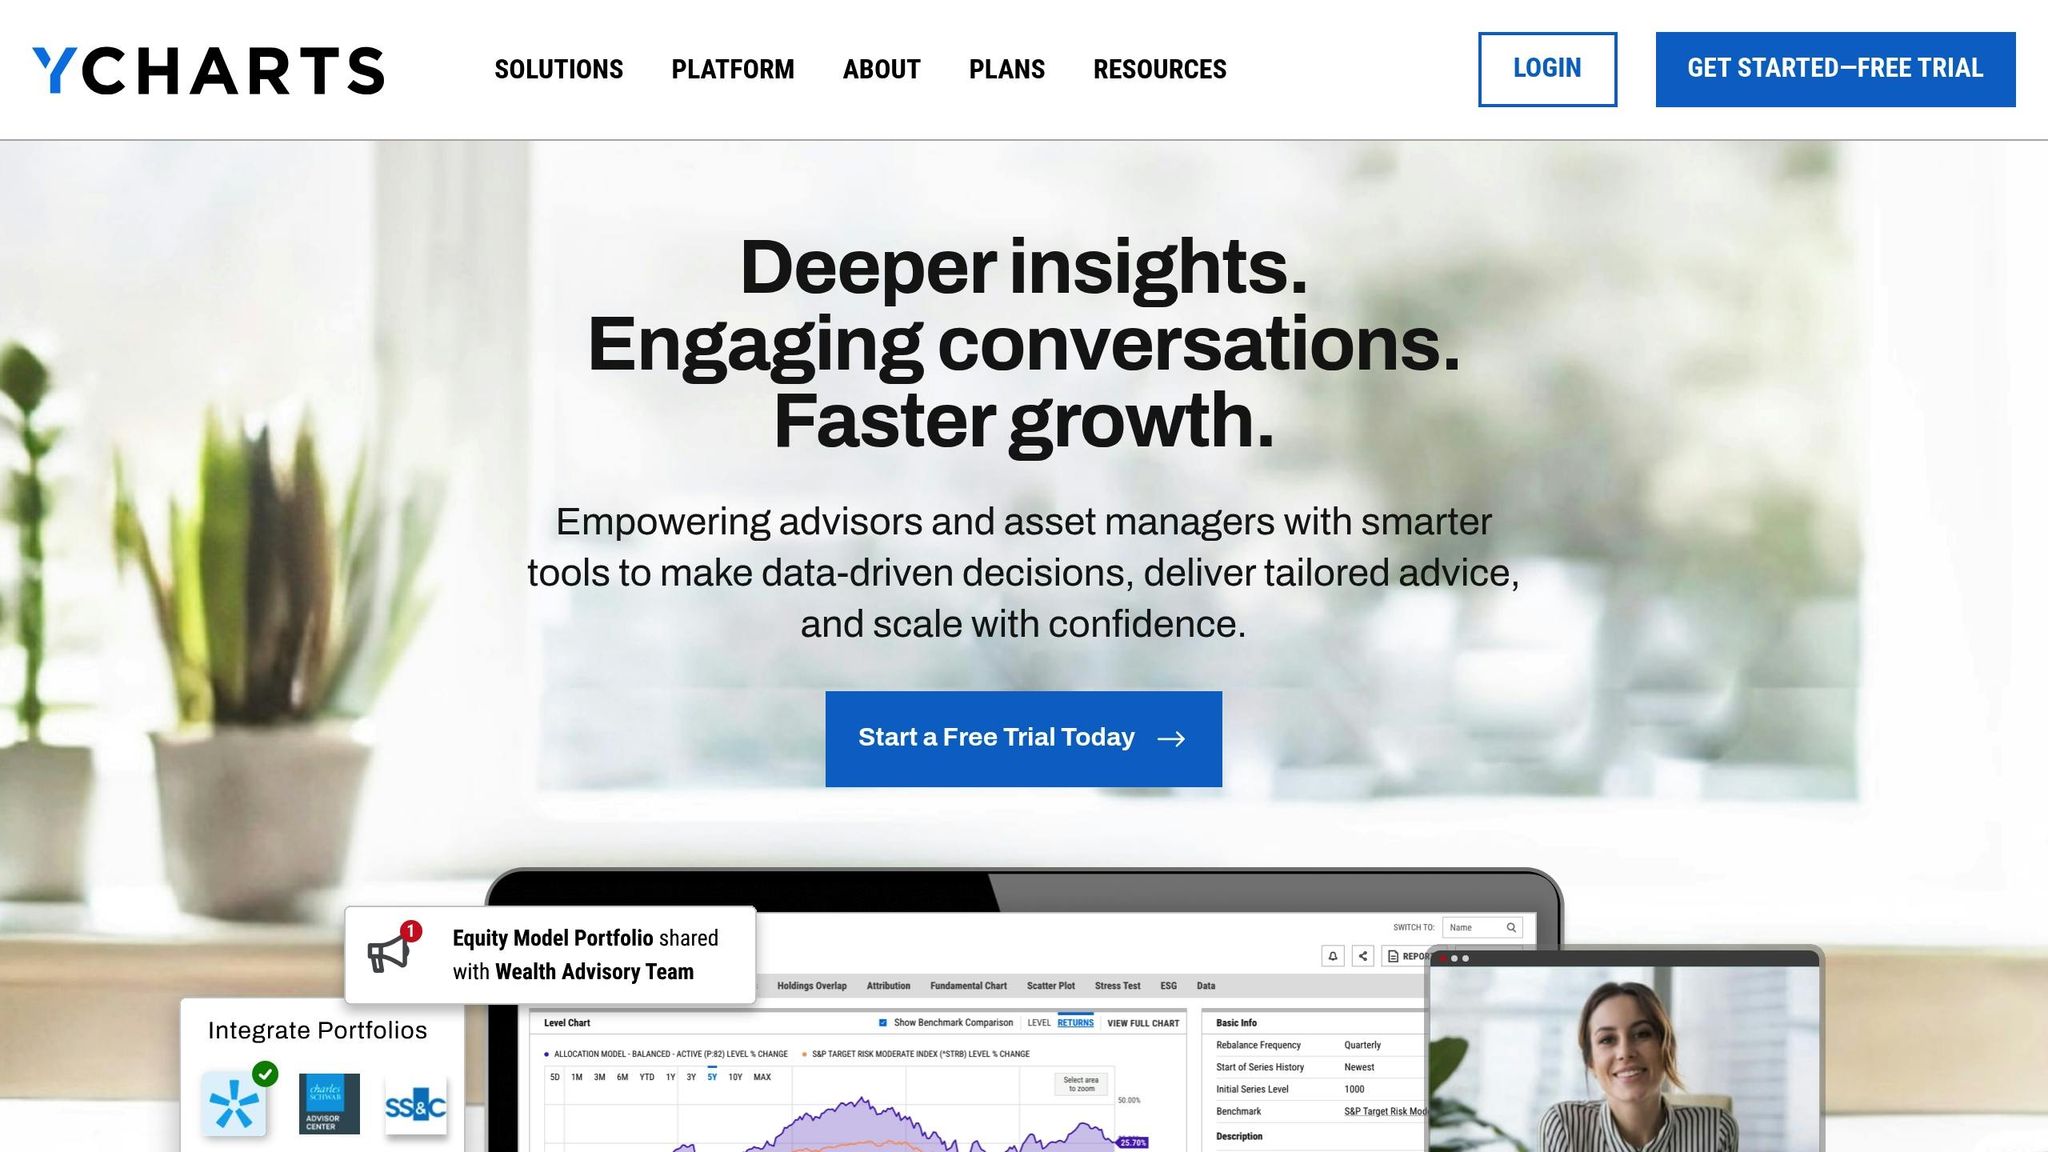
YCharts focuses on data visualization and is praised for its intuitive, user-friendly interface [9]. It’s ideal for creating polished, presentation-ready charts, thanks to drag-and-drop report templates and access to over 6,000 economic data series. Unlike Bloomberg Terminal or S&P Capital IQ Pro, YCharts prioritizes visual simplicity over sheer data volume.
The platform offers four pricing tiers - Analyst, Presenter, Professional, and Enterprise - with custom pricing available upon request. It also provides a seven-day free trial [9]. Financial advisors and investor relations teams value YCharts for its ability to transform complex datasets into clear, visually appealing reports without requiring advanced technical expertise.

Visora takes financial benchmarking to the next level by turning data into actionable strategies that drive measurable revenue growth. By combining advanced benchmarking tools with an AI-powered acquisition framework, Visora offers U.S.-based B2B financial leaders a practical way to transform insights into results. Their 12-week Trifecta Program is designed to generate exclusive deal flow - without relying on referrals, heavy ad spending, or adding more staff. Let’s break down how each part of Visora's framework supports financial benchmarking and growth.
Imagine saving nearly half your time on lead generation. That’s what Visora’s AI-powered tools deliver. By automating lead generation, finance professionals can focus on high-value activities like variance analysis, KPI tracking, and financial modeling. According to research, AI-driven automation can free up to 40% of a professional's time [11].
Visora’s AI systems act as smart filters, ensuring only qualified leads make it into the pipeline. This means benchmarking insights are applied directly to identify and engage the most promising prospects. The result? A more efficient, data-driven approach to decision-making that maximizes both time and resources.
The B2B Vortex Funnel is a structured system that ties financial benchmarking data to the acquisition process. This framework not only tracks financial performance but also uncovers revenue gaps and cost-saving opportunities. Leaders gain a comprehensive view of their financial health, enabling smarter resource allocation and more accurate scenario planning.
For example, Visora helped a private equity firm discover over $20 million in new partnership opportunities within just 180 days. By aligning their acquisition funnel with targeted performance tracking, the firm was able to turn benchmarking insights into tangible revenue growth. This approach ensures that every strategic move is backed by data and delivers measurable outcomes.
Visora’s Due Diligence (DD) Strategy Consulting takes benchmarking data and integrates it with acquisition and growth strategies. Using AI-driven analytics, Visora enhances due diligence processes, identifying up to 95% of material issues compared to only 65% with manual reviews [7]. This level of precision helps leaders better quantify their competitive edge by comparing internal metrics - like operating margins and profitability ratios - with industry benchmarks.
Additionally, Visora’s AI tools accelerate the creation of Quality of Earnings reports by 60% [7]. In one standout case, they identified a $50 million partnership opportunity for a corporate finance firm in just 45 days. By combining benchmarking data with strategic advisory insights, Visora ensures financial planning aligns with growth objectives while pinpointing areas for improvement. This means leaders can turn benchmarking insights into real competitive advantages, faster than ever before.

Financial Benchmarking Tools Comparison 2025: Features, Pricing and Implementation
Selecting the right financial benchmarking tool comes down to your workflow, technical requirements, and budget. For institutional investors who need real-time market data, Bloomberg Terminal offers advanced analytics. Meanwhile, S&P Capital IQ Pro uses Kensho AI to enhance macro scenario modeling, making it a strong choice for investment professionals.
For teams reliant on Excel, tools like Datarails and Vena streamline data consolidation while maintaining familiar workflows. For example, in 2025, a global manufacturer cut its financial close cycle from 15 days to 9 by adopting Datarails, saving their FP&A team 40% of the time previously spent on manual data gathering [13]. On the other hand, enterprise-level platforms like Anaplan cater to organizations with complex, cross-functional planning needs. However, these systems often come with six-figure contracts and require 6–12 months for full implementation.
Here’s a quick comparison of leading financial benchmarking tools:
| Tool | Best For | Key Strength | Starting Price | Implementation Time |
|---|---|---|---|---|
| Bloomberg Terminal | Investors & Bankers | Real-time market data & institutional analytics | Premium (around $24,000+/year) | Immediate |
| S&P Capital IQ Pro | Investment Professionals | Macro scenario modeling with Kensho AI | Premium (custom pricing) | 1–2 weeks |
| Datarails | Excel-centric teams | Automated data consolidation with AI dashboards | Starting at ~$1,000/month | Varies |
| Vena | Excel-heavy workflows | Excel-native interface with AI-driven variance detection | Varies | Varies |
| Anaplan | Global Enterprises | Multi-dimensional planning and predictive analytics | Often six-figure contracts | 6–12 months |
Automated tools like these can dramatically improve efficiency. They speed up financial close processes, reduce errors (88% of manual spreadsheets contain errors [14]), and enhance decision-making with real-time variance analysis. Additionally, they integrate smoothly with ERP and CRM systems, eliminating the need for manual data entry.
For example, in 2024, Fintool showcased its ability to deliver financial research nine times faster and 33 times cheaper than entry-level human analysts, achieving 90% accuracy on complex SEC filing analysis [5]. These advancements highlight the potential for automation to transform financial operations and analysis.
Selecting the right financial benchmarking tool begins with a thorough data audit. Start by cleaning and organizing your internal financial data to ensure that AI-generated benchmarks are as accurate as possible [13][6]. Considering that nearly one-third of finance data professionals already allocate over 40% of their budgets to data management [8], getting this step right can save both time and money in the long run.
After your data is in order, move on to rigorous testing. Use your historical data to evaluate how different platforms handle the unique challenges of your financial operations [2][6]. Choose a tool that aligns well with your team's technical skills and integrates smoothly into your existing workflows.
Once you’ve tested tools, consider leveraging strategic partnerships to simplify implementation. For instance, B2B leaders in sectors like financial services, real estate, or investment firms may benefit from consulting services to align tools with their growth strategies. Companies like Visora specialize in helping U.S.-based B2B leaders enhance proprietary deal flow and build meaningful relationships through AI-augmented systems and private market intelligence. Their Trifecta Program - which includes the B2B Vortex Funnel, AI Augmented Appointment Setting, and DD Strategic Advisory - has enabled clients to uncover new partnership opportunities and achieve measurable growth.
When you’ve narrowed down your options, factor in the Total Cost of Ownership (TCO). Beyond subscription fees, include costs for implementation, training, and integration [11]. Ensure the chosen tool works seamlessly with your existing systems like ERP, CRM, and HRIS platforms to maintain a unified data source [12][11]. It's often best to start with a single use case, such as cash flow forecasting or tracking a specific KPI, to validate the tool’s performance against historical data before scaling it across your organization [13].
Lastly, prioritize human oversight for all AI-driven outputs. As finance leader Nicolas Boucher wisely points out:
"AI is here to stay and ignoring it would be like ignoring Excel when it was released 40 years ago" [6].
While AI can enhance efficiency, strategic decisions still rely on human judgment and context. Regularly update your benchmarks to reflect market changes, and zero in on key metrics like operating margins, revenue growth, and cash flow management to ensure your efforts deliver the greatest impact [1].
AI-driven financial benchmarking tools bring a host of benefits that go beyond what traditional spreadsheets can offer. One of the standout advantages is their ability to dramatically boost speed and efficiency. By automating data collection, analysis, and reporting, these tools enable teams to generate insights almost instantly. This not only saves time but also significantly reduces the likelihood of human error, a common issue with manual spreadsheet work. The result? Financial data that's far more accurate and dependable.
Another major perk is their capacity to handle massive amounts of data from multiple sources at once. This capability allows AI tools to identify patterns, trends, and anomalies that would likely go unnoticed with manual analysis. On top of that, many of these tools include features like predictive analytics and scenario modeling. These tools help teams anticipate future performance and make smarter, data-driven strategic decisions.
By automating routine tasks and improving data accuracy, AI tools allow finance professionals to shift their focus to more impactful activities, such as planning and driving business growth.
AI-powered tools are transforming financial forecasting by leveraging machine learning, predictive analytics, and automation to process vast amounts of historical data. These tools excel at spotting patterns and trends that might slip past traditional methods, leading to forecasts that are not only more accurate but also more dependable. Plus, they adjust in real time as fresh data rolls in or market conditions shift, minimizing human error and boosting adaptability.
By automating repetitive tasks like gathering, cleaning, and organizing data, these tools free up finance teams to concentrate on strategic decisions rather than tedious manual work. They also make it easier to run rapid scenario modeling and variance analysis, enabling businesses to explore different outcomes quickly and act on well-informed insights. In short, AI tools make financial forecasting faster, more precise, and better equipped to handle the ever-changing market landscape.
When connecting financial benchmarking tools with ERP or CRM systems, there are a few key points to keep in mind to ensure the process runs smoothly and delivers accurate results.
First, compatibility is a must. The tools need to integrate effortlessly with your current systems, including matching data formats and working with APIs. Without this, the integration could lead to unnecessary delays or errors.
Next, focus on data quality. Make sure all the information used is clean, consistent, and current. Benchmarking relies on precise data, so outdated or messy records can skew results and reduce the value of your analysis.
Security and compliance are equally important, particularly when handling sensitive financial information. Stay aligned with data privacy laws and put strong protections in place to guard against breaches or unauthorized access.
Finally, think about scalability. The tools you choose should be able to grow with your business and adapt to changing needs without requiring a complete overhaul. By planning ahead and thoroughly testing the integration, you can ensure a smoother process and get the most out of your benchmarking tools.
%20(5).png)
