%20Bold.png)

Tracking lead conversion time is essential for improving your sales process and increasing revenue. It measures how long it takes to turn a prospect into a customer, helping you identify delays, optimize resources, and close deals faster. For mid-market SaaS companies, the average conversion time is 84 days, but reducing this by 20% can boost cash flow by 15%. Here’s what you need to know:
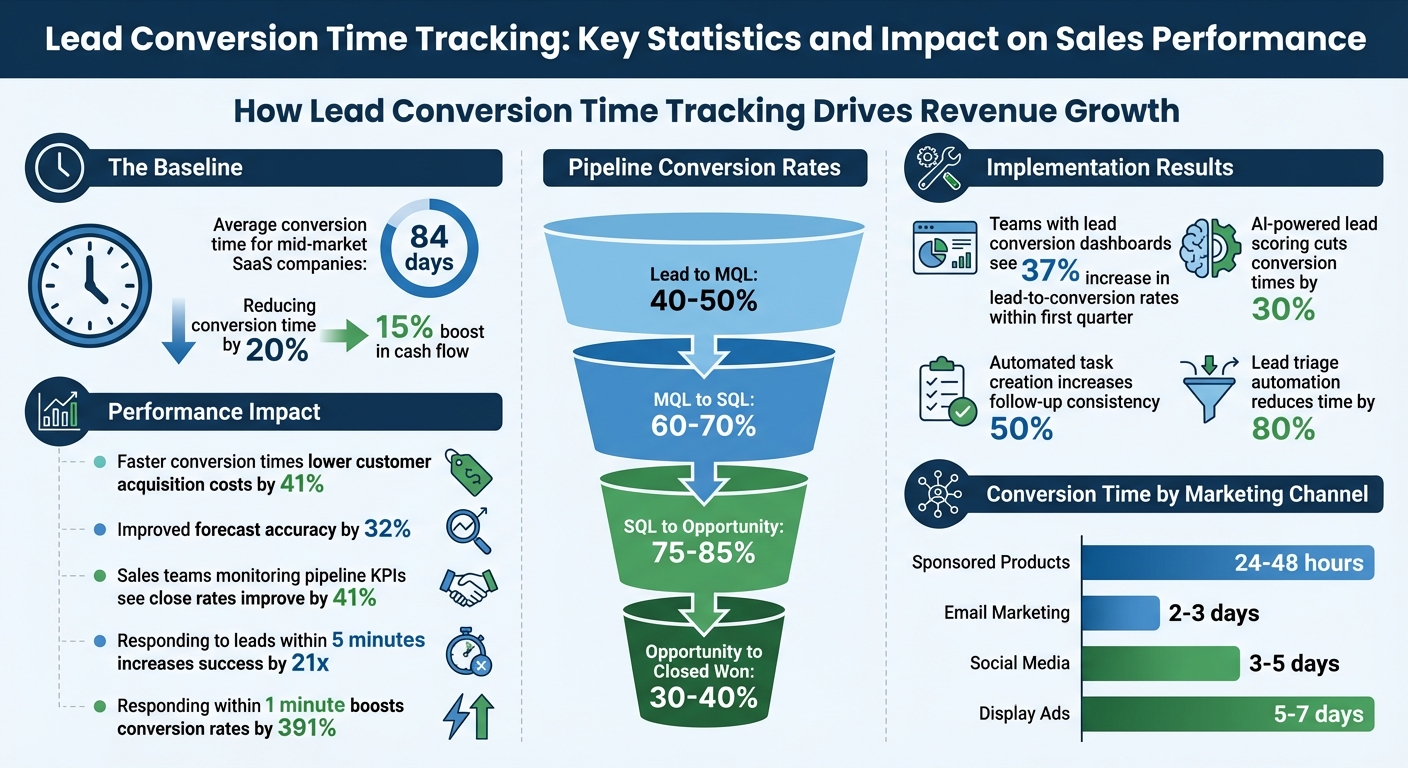
Lead Conversion Time Tracking: Key Statistics and Impact on Sales Performance
Tracking lead conversion time gives you a clear picture of where your sales process might be slowing down and helps you build a predictable pipeline and speed up revenue generation. By knowing how long it takes to move leads through your pipeline, you can fine-tune your sales strategy, allocate resources more effectively, and grow faster. Let’s dive into how tracking conversion time can improve sales performance, reveal customer journey insights, and accelerate revenue.
Conversion time data helps sales teams focus on the leads that matter most. Instead of spreading their efforts thin, your team can prioritize prospects that are actively progressing. Sales teams that regularly monitor pipeline KPIs, like stage duration, see their close rates improve by 41% [7]. Why? Because they can quickly identify which deals are advancing and which ones need attention.
Speed is critical. Reaching out to a lead within five minutes increases your chances of success by 21 times and nearly doubles the likelihood that they’ll choose your service [8]. By tracking conversion time, you can set specific response time goals to ensure your team capitalizes on these crucial moments.
Detailed conversion metrics reveal exactly where prospects get stuck in your pipeline. By analyzing conversion time and its sub-intervals (like MQL to SQL), you can pinpoint friction points. For instance, if deals consistently stall during the proposal stage, it might indicate pricing concerns or the absence of key decision-makers [7].
This level of detail acts like an early warning system. Changes in conversion time can highlight issues like poor product-market fit, increased competition, or internal bottlenecks before they affect your bottom line [1]. Instead of waiting for quarterly reports to uncover problems, you can address them as they arise.
Here’s a quick look at how pipeline stage data can guide your focus:
| Pipeline Stage | Expected Conversion Rate | Focus Area for Efficiency |
|---|---|---|
| Lead to MQL | 40-50% | Lead scoring accuracy |
| MQL to SQL | 60-70% | Discovery call quality |
| SQL to Opportunity | 75-85% | Needs assessment process |
| Opportunity to Closed Won | 30-40% | Proposal and negotiation skills |
Segmenting your data by lead source, industry, or product type can uncover trends that averages might hide. For example, you might find that leads from webinars convert 40% faster than cold outreach, giving you valuable insight into where your marketing budget should go.
Shorter conversion times mean faster cash flow. SaaS companies that cut their conversion times by 20% saw a 15% boost in cash flow on average [1]. Jason Cohen, Founder of WP Engine, sums it up perfectly:
"The SaaS companies that win aren't just those with the best product or the biggest sales team, but those who most efficiently convert interest into revenue" [1].
Tracking conversion time also sharpens your forecasting. Companies that implement formal tracking see a 32% improvement in quarterly forecast accuracy [1]. This allows for better decisions around hiring, product development, and market expansion. Instead of guessing when deals will close, you’ll have reliable data to work with.
You don’t need to reinvent your sales process to track lead conversion times effectively. The trick lies in selecting the right CRM, setting it up to record timestamps automatically, and designing workflows that keep your data organized. Here’s how to create a system that delivers accurate conversion data from day one.
Your CRM should handle three essential tasks: capturing timestamps automatically, allowing custom property creation, and automating workflows. Tools like Salesforce, HubSpot, and Zoho CRM offer these features, but the best fit depends on your sales process and budget.
For high-volume, transactional sales under $2,000, a simple CRM with 4–5 pipeline stages can boost conversion rates by 5–10% [3]. B2B service businesses often benefit from milestone-based pipelines with 5–7 stages, improving forecast accuracy by 15–20% [3]. For enterprise-level deals over $50,000, qualification frameworks like MEDDIC can increase win rates by 20–30% [3].
Keep your setup straightforward. Overly complicated pipelines with 12–15 stages can reduce CRM adoption rates by 20–25% [3]. Stick to 10–15 essential custom properties to ensure your team uses the system effectively [3]. As Aeroleads advises:
"A pipeline should reflect the customer's journey, not your internal bureaucracy. This is the first principle of effective pipeline design." – Aeroleads [3]
If you rely on third-party communication tools, prioritize CRMs with bidirectional sync features. For instance, Aloware (starting at $30 per agent monthly) integrates with HubSpot to timestamp calls and SMS in real time [12]. Note that HubSpot’s advanced automation capabilities often require Sales Hub Professional or Enterprise subscriptions [3]. If setup feels overwhelming, certified partners can rebuild your pipeline for $3,000–$8,000 [3].
Once you’ve chosen a CRM, the next step is configuring it to capture lead timestamps automatically.
Automating timestamp capture eliminates manual errors and ensures consistent tracking. Configure your CRM to log timestamps whenever a lead’s status changes [10][14].
Start by creating custom date fields for key milestones. In HubSpot, for example, you can set up properties like "Date Entered Discovery" or "First Outbound Engagement Date" [3][12]. Always use date pickers instead of free-text fields to keep data consistent [3]. Then, design workflows that automatically update these fields based on status changes [14].
For Salesforce users, enable "Lead History Tracking" on the Status field [13]. To track every transition, create a custom "Lead Status History" object with fields like Lead Status (picklist), Status Change Date (date), and a lookup to the Lead object. Use a record-triggered flow to log a new record in the history object every time the Lead Status updates [13].
Define clear criteria for moving leads through stages. Teams that use custom properties to enforce qualification criteria see a 23% higher lead-to-opportunity conversion rate [3]. For example, require confirmation of budget and decision-maker access before advancing a lead from "Discovery" to "Proposal." Make these fields mandatory in your workflows to avoid premature stage changes [3].
You can also use activity-based triggers to update statuses automatically. For instance, mark a lead as "Attempted to Contact" after sending the first sales email or "Connected" after a call lasts longer than one minute [11]. These automations keep your pipeline updated and save sales reps 3–5 hours per week [3].
With timestamps in place, you’re ready to build workflows that ensure data accuracy and identify potential issues early.
Workflows help maintain clean data and flag problems before they hurt your bottom line. For example, set up alerts to notify managers when a lead stays in a stage for more than 1.5× the average duration [3]. These stalled deals often account for up to 80% of missed forecasts [3].
Use calculation properties to measure stage duration automatically. In HubSpot, go to Reports > Create Report > Single Object > Contacts, and create a calculation property to subtract the "Start Date" from the "End Date" [9]. This gives you instant insights into how long leads spend in each stage.
When rolling out new workflows, exclude existing deals to avoid skewed data from backdated entries [14]. Segment workflows by lead type - enterprise deals require different nurturing than transactional sales under $2,000 [15]. Automating task creation can increase follow-up consistency by over 50% [3], ensuring your team stays on track with key touchpoints.
Standardize lead statuses using automated triggers, but leave "Unqualified" for manual updates by reps [11]. This approach captures specific reasons (e.g., “Bad Fit” vs. “Bad Timing”) that automation might miss, giving you actionable insights into where deals are stalling and how to address them.
Once your CRM is set up, it’s time to dig into the data. Why? Because understanding and acting on these insights can cut lead conversion time by 20% and give your cash flow a 15% boost [1]. The difference between teams that consistently hit their revenue goals and those that don’t often boils down to how they interpret and act on their data.
Your dashboard should focus on three essential metrics: Time-to-Conversion (how long it takes from first contact to a closed deal), Lead Velocity (how quickly leads move through pipeline stages), and Stage-Specific Conversion Rates [16][18]. Keep these metrics front and center in a simple grid layout [16].
To make the data actionable, use visual tools like:
Set up alerts to notify your team when lead response times or stage durations exceed acceptable limits. Quick responses matter - reaching out to a lead within one minute can boost conversion rates by an eye-popping 391% [18].
For real-time updates, integrate your CRM with tools like Google Analytics 4 using APIs [16][2]. If your CRM doesn’t have built-in conversion formulas, create workflows to assign "Won" deals a 100% score and "Lost" deals a 0% score. Use these values to calculate your average conversion rate [6]. Interactive dashboard features can also let you dive deeper into specific stages or marketing channels [16].
Teams that implement lead conversion dashboards often see a 37% increase in lead-to-conversion rates within the first quarter [16]. As Kinga Edwards from monday.com puts it:
"A lead analytics dashboard... shows you exactly which marketing channels deliver buyers (not just clicks), where prospects stall in your pipeline, and which reps need coaching." [18]
The next step is tackling the bottlenecks that slow these metrics down.
Your data can pinpoint where deals are stalling. Common issues include:
Funnel visualization reports can help you see conversion rates between stages and identify where leaks occur [17][3]. Additionally, measuring the average time spent in each stage can highlight problem areas. For instance, CRM Magnetics worked with a mid-size B2B tech firm in October 2025 and uncovered a 46% drop-off between the "Demo" and "Proposal" stages. The issue? Reps weren’t logging follow-ups. By adding automated task reminders and alerts, the firm cut that drop-off in half within 90 days [17].
To prevent these issues, enforce exit criteria with mandatory CRM fields that must be completed before advancing a lead to the next stage [3]. Teams that use custom qualification properties see a 23% higher conversion rate from lead to opportunity [3]. Also, avoid overloading your pipeline with too many stages - stick to 5–7 meaningful milestones. This keeps things manageable for reps and ensures cleaner data [3].
These fixes allow you to focus your resources where they’ll have the most impact.
Let your conversion data guide how you allocate time and money. For example, prioritize marketing channels with quicker conversion windows to speed up cash flow [2][1]. Here’s a breakdown of typical conversion times by channel:
| Marketing Channel | Typical Conversion Window |
|---|---|
| Sponsored Products | 24–48 hours |
| Email Marketing | 2–3 days |
| Social Media | 3–5 days |
| Display Ads | 5–7 days |
Segment your data by lead source, product tier, or company size to uncover specific opportunities for improvement [1]. SaaS companies in the top quartile for conversion speed often enjoy 41% lower customer acquisition costs [1].
To reduce friction in the buyer’s journey, consider simplifying pricing structures or automating contract generation. Companies that streamlined pricing have seen enterprise deal closing times shrink by 17% [1].
You can also address objections that slow down specific stages by creating targeted content. And don’t forget to use AI-powered lead scoring to focus on high-intent leads, which can cut conversion times by 30% [1].
Once your tracking systems are optimized, teaming up with experts can take your lead conversion efforts to the next level. Setting up and fine-tuning lead conversion tracking often requires skills that many teams might not have in-house. Revenue advisory firms can help cut down on months of trial-and-error by implementing tested frameworks and leveraging AI-powered tools.

Visora specializes in turning CRMs into powerful revenue-generating machines by combining automation with AI-driven insights [5]. Their approach streamlines business development by automating tasks like lead triage. For example, their system can classify responses - such as identifying interest, objections, or out-of-office replies - and even draft responses. This automation reduces the time spent on lead triage by a staggering 80% [5].
Their CRM system also incorporates visual Kanban boards, offering teams real-time visibility into deal progress. Using Lead Velocity Rate (LVR) tracking, Visora measures how long prospects stay in each pipeline stage. This precision helps teams identify and address bottlenecks quickly [4]. Think of it as an assembly line for deals - each stage is a measurable, improvable process that can be sped up [5].
For U.S.-based B2B leaders in industries like investment firms, finance, real estate, SaaS, and consulting, Visora's system delivers results in just 12 weeks. And they do it without relying on expensive ad campaigns or word-of-mouth referrals.
Visora's strategies have delivered impressive results across industries. For instance, they uncovered a $50 million partnership opportunity for a corporate finance firm in just 45 days. Similarly, a private equity firm identified over $20 million in new partnership opportunities within 180 days. A real estate syndicate benefited from $2.25 million+ in new project and partnership opportunities within 45 days.
These achievements are made possible by combining AI technology, private market intelligence, and multi-channel CRM tracking. This approach gives teams a clear view of which leads to prioritize, where deals are stalling, and how to allocate resources effectively. These examples highlight how partnering with revenue advisory experts can complement your tracking efforts and drive faster growth.
Tracking lead conversion time isn't just a nice-to-have - it’s a game changer for your sales process. By replacing guesswork with data-driven strategies, you gain actionable insights that can directly improve your revenue outcomes.
The numbers speak for themselves: B2B SaaS companies with structured lead conversion tracking achieve quarterly forecasts that are 32% more accurate. Additionally, companies in the fastest quartile for conversion times see a 41% reduction in customer acquisition costs [1].
Using the right CRM and automation tools can make a huge difference. These tools improve pipeline visibility by three times and reduce lead triage time by 80% with AI-powered automation [5]. That means your sales team can spend less time on administrative work and more time closing deals.
To implement this effectively, focus on clear stage definitions, automated timestamps, conversion dashboards, and regular analysis to uncover and address bottlenecks. For U.S.-based B2B leaders in industries like investment firms, finance, real estate, SaaS, and consulting, working with revenue advisory experts such as Visora can streamline the process. Their 12-week implementation program eliminates months of trial and error, delivering measurable results.
Transform your pipeline into a powerful revenue engine by putting these proven strategies into action today.
To measure conversion time effectively, focus on creating pipeline stages that mirror the customer's journey rather than your internal workflows. Use straightforward, customer-focused stages like:
Steer clear of overly complex or internally driven stages, as these can create unnecessary confusion. When your stages are aligned with the customer experience, it becomes easier to track how long prospects spend in each phase, pinpoint bottlenecks, and refine the accuracy of your pipeline.
To monitor how long it takes for leads to move between stages, leverage calculated properties and automation tools within your CRM. Start by creating date-specific properties for each stage, such as MQL, SQL, and Opportunity. Then, set up calculated fields to automatically measure the time elapsed between these stages. With automation features, these fields can update in real time as leads advance, removing the need for manual updates and giving you ongoing visibility into conversion times.
If leads are getting stuck in one stage, it's time to dig into the problem. Common culprits include missed follow-ups, delays in decision-making, or ineffective lead scoring. To tackle this:
It's also smart to address decision-maker concerns early by providing tailored ROI insights that speak directly to their needs. Consistently monitoring and fine-tuning your process can help avoid bottlenecks and ensure leads flow smoothly through your pipeline.
%20(5).png)
